Bahamian vs Immigrants from Kuwait Single Male Poverty
COMPARE
Bahamian
Immigrants from Kuwait
Single Male Poverty
Single Male Poverty Comparison
Bahamians
Immigrants from Kuwait
14.6%
SINGLE MALE POVERTY
0.0/ 100
METRIC RATING
291st/ 347
METRIC RANK
12.9%
SINGLE MALE POVERTY
31.9/ 100
METRIC RATING
187th/ 347
METRIC RANK
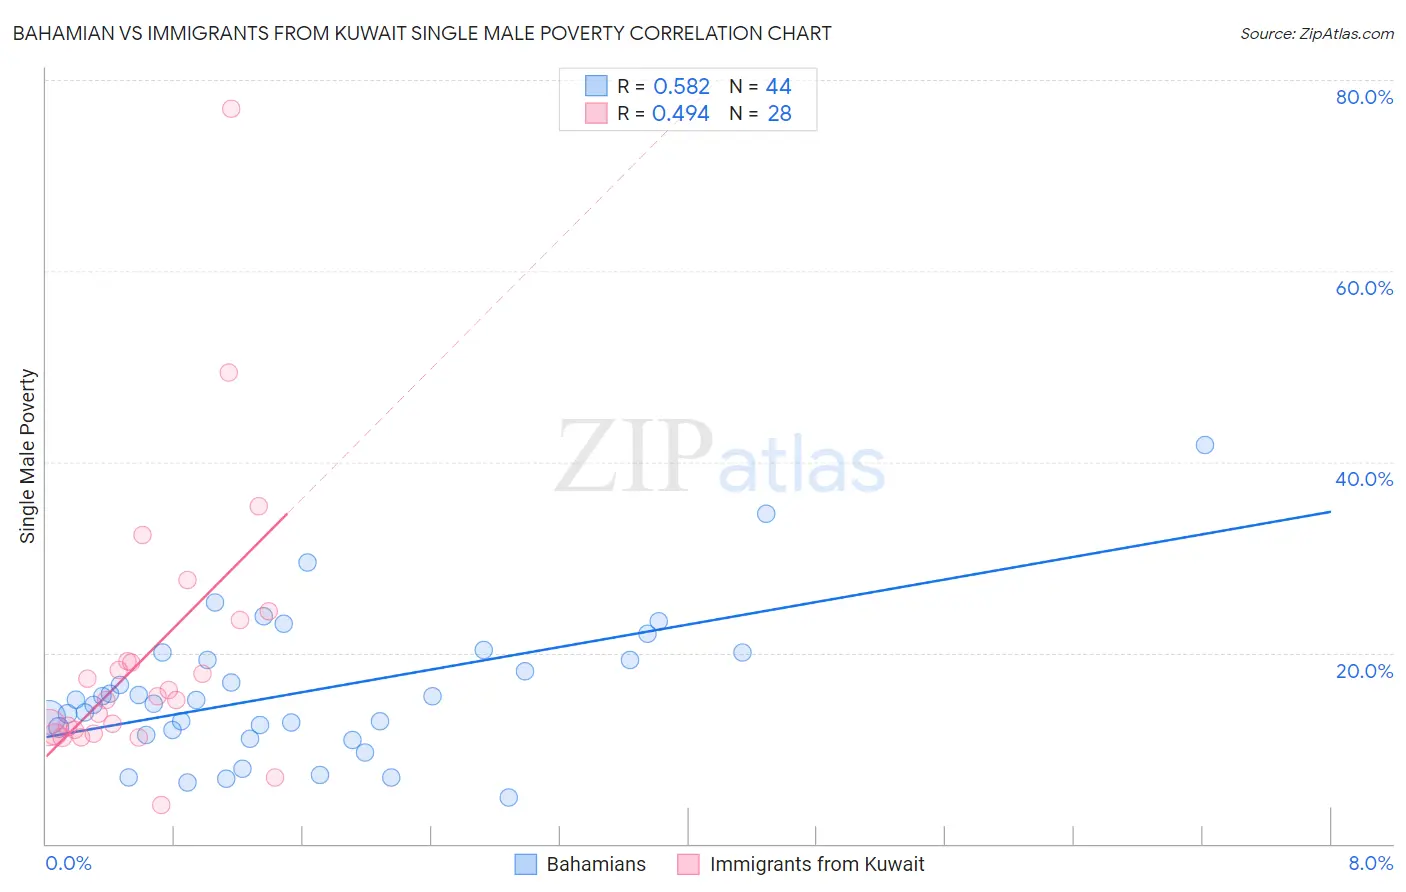
Bahamian vs Immigrants from Kuwait Single Male Poverty Correlation Chart
The statistical analysis conducted on geographies consisting of 108,151,039 people shows a substantial positive correlation between the proportion of Bahamians and poverty level among single males in the United States with a correlation coefficient (R) of 0.582 and weighted average of 14.6%. Similarly, the statistical analysis conducted on geographies consisting of 129,103,469 people shows a moderate positive correlation between the proportion of Immigrants from Kuwait and poverty level among single males in the United States with a correlation coefficient (R) of 0.494 and weighted average of 12.9%, a difference of 12.6%.
Single Male Poverty Correlation Summary
| Measurement | Bahamian | Immigrants from Kuwait |
| Minimum | 4.8% | 4.1% |
| Maximum | 41.8% | 77.0% |
| Range | 37.0% | 73.0% |
| Mean | 15.9% | 19.7% |
| Median | 14.8% | 15.2% |
| Interquartile 25% (IQ1) | 11.7% | 11.7% |
| Interquartile 75% (IQ3) | 19.6% | 21.3% |
| Interquartile Range (IQR) | 7.9% | 9.6% |
| Standard Deviation (Sample) | 7.4% | 14.6% |
| Standard Deviation (Population) | 7.4% | 14.4% |
Similar Demographics by Single Male Poverty
Demographics Similar to Bahamians by Single Male Poverty
In terms of single male poverty, the demographic groups most similar to Bahamians are Nonimmigrants (14.6%, a difference of 0.13%), U.S. Virgin Islander (14.5%, a difference of 0.15%), French Canadian (14.6%, a difference of 0.25%), Immigrants from Dominica (14.5%, a difference of 0.38%), and Ottawa (14.6%, a difference of 0.43%).
| Demographics | Rating | Rank | Single Male Poverty |
| Immigrants | Bahamas | 0.0 /100 | #284 | Tragic 14.4% |
| French | 0.0 /100 | #285 | Tragic 14.4% |
| Celtics | 0.0 /100 | #286 | Tragic 14.5% |
| Iroquois | 0.0 /100 | #287 | Tragic 14.5% |
| Whites/Caucasians | 0.0 /100 | #288 | Tragic 14.5% |
| Immigrants | Dominica | 0.0 /100 | #289 | Tragic 14.5% |
| U.S. Virgin Islanders | 0.0 /100 | #290 | Tragic 14.5% |
| Bahamians | 0.0 /100 | #291 | Tragic 14.6% |
| Immigrants | Nonimmigrants | 0.0 /100 | #292 | Tragic 14.6% |
| French Canadians | 0.0 /100 | #293 | Tragic 14.6% |
| Ottawa | 0.0 /100 | #294 | Tragic 14.6% |
| Scotch-Irish | 0.0 /100 | #295 | Tragic 14.7% |
| Africans | 0.0 /100 | #296 | Tragic 14.7% |
| Immigrants | Dominican Republic | 0.0 /100 | #297 | Tragic 14.8% |
| French American Indians | 0.0 /100 | #298 | Tragic 15.0% |
Demographics Similar to Immigrants from Kuwait by Single Male Poverty
In terms of single male poverty, the demographic groups most similar to Immigrants from Kuwait are Nigerian (12.9%, a difference of 0.0%), Norwegian (12.9%, a difference of 0.010%), Macedonian (12.9%, a difference of 0.020%), Immigrants from Trinidad and Tobago (12.9%, a difference of 0.040%), and Immigrants from West Indies (12.9%, a difference of 0.060%).
| Demographics | Rating | Rank | Single Male Poverty |
| Immigrants | North America | 37.7 /100 | #180 | Fair 12.9% |
| Panamanians | 37.6 /100 | #181 | Fair 12.9% |
| Moroccans | 36.8 /100 | #182 | Fair 12.9% |
| Immigrants | West Indies | 33.0 /100 | #183 | Fair 12.9% |
| Immigrants | Trinidad and Tobago | 32.5 /100 | #184 | Fair 12.9% |
| Norwegians | 32.0 /100 | #185 | Fair 12.9% |
| Nigerians | 31.9 /100 | #186 | Fair 12.9% |
| Immigrants | Kuwait | 31.9 /100 | #187 | Fair 12.9% |
| Macedonians | 31.5 /100 | #188 | Fair 12.9% |
| Portuguese | 30.2 /100 | #189 | Fair 12.9% |
| Arabs | 27.0 /100 | #190 | Fair 13.0% |
| Immigrants | Thailand | 26.6 /100 | #191 | Fair 13.0% |
| Immigrants | Jamaica | 26.5 /100 | #192 | Fair 13.0% |
| Immigrants | South Africa | 26.1 /100 | #193 | Fair 13.0% |
| Liberians | 25.2 /100 | #194 | Fair 13.0% |