Vietnamese vs Apache Child Poverty Among Boys Under 16
COMPARE
Vietnamese
Apache
Child Poverty Among Boys Under 16
Child Poverty Among Boys Under 16 Comparison
Vietnamese
Apache
19.6%
CHILD POVERTY AMONG BOYS UNDER 16
0.1/ 100
METRIC RATING
267th/ 347
METRIC RANK
24.5%
CHILD POVERTY AMONG BOYS UNDER 16
0.0/ 100
METRIC RATING
333rd/ 347
METRIC RANK
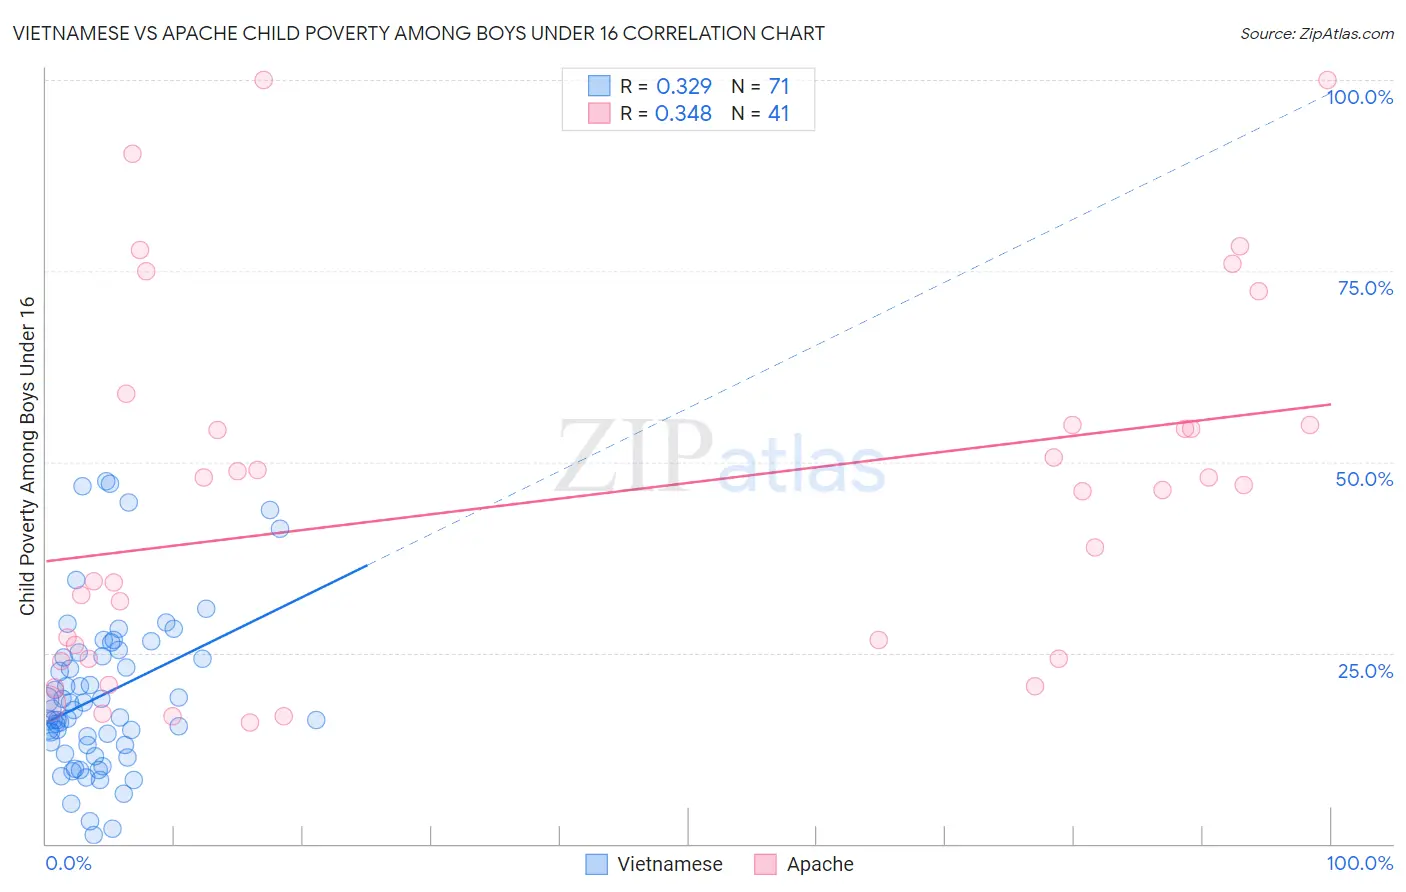
Vietnamese vs Apache Child Poverty Among Boys Under 16 Correlation Chart
The statistical analysis conducted on geographies consisting of 169,843,059 people shows a mild positive correlation between the proportion of Vietnamese and poverty level among boys under the age of 16 in the United States with a correlation coefficient (R) of 0.329 and weighted average of 19.6%. Similarly, the statistical analysis conducted on geographies consisting of 229,742,001 people shows a mild positive correlation between the proportion of Apache and poverty level among boys under the age of 16 in the United States with a correlation coefficient (R) of 0.348 and weighted average of 24.5%, a difference of 25.0%.
Child Poverty Among Boys Under 16 Correlation Summary
| Measurement | Vietnamese | Apache |
| Minimum | 1.2% | 15.9% |
| Maximum | 47.5% | 100.0% |
| Range | 46.4% | 84.1% |
| Mean | 19.5% | 45.2% |
| Median | 17.5% | 46.3% |
| Interquartile 25% (IQ1) | 12.9% | 24.3% |
| Interquartile 75% (IQ3) | 25.0% | 54.8% |
| Interquartile Range (IQR) | 12.1% | 30.6% |
| Standard Deviation (Sample) | 10.6% | 23.6% |
| Standard Deviation (Population) | 10.5% | 23.3% |
Similar Demographics by Child Poverty Among Boys Under 16
Demographics Similar to Vietnamese by Child Poverty Among Boys Under 16
In terms of child poverty among boys under 16, the demographic groups most similar to Vietnamese are Immigrants from El Salvador (19.6%, a difference of 0.010%), Guyanese (19.6%, a difference of 0.060%), Spanish American Indian (19.6%, a difference of 0.11%), Iroquois (19.6%, a difference of 0.15%), and Immigrants from Cabo Verde (19.7%, a difference of 0.27%).
| Demographics | Rating | Rank | Child Poverty Among Boys Under 16 |
| Shoshone | 0.2 /100 | #260 | Tragic 19.4% |
| Immigrants | Ghana | 0.2 /100 | #261 | Tragic 19.4% |
| Immigrants | Guyana | 0.1 /100 | #262 | Tragic 19.5% |
| Ottawa | 0.1 /100 | #263 | Tragic 19.5% |
| Iroquois | 0.1 /100 | #264 | Tragic 19.6% |
| Guyanese | 0.1 /100 | #265 | Tragic 19.6% |
| Immigrants | El Salvador | 0.1 /100 | #266 | Tragic 19.6% |
| Vietnamese | 0.1 /100 | #267 | Tragic 19.6% |
| Spanish American Indians | 0.1 /100 | #268 | Tragic 19.6% |
| Immigrants | Cabo Verde | 0.1 /100 | #269 | Tragic 19.7% |
| Cherokee | 0.1 /100 | #270 | Tragic 19.7% |
| Chickasaw | 0.1 /100 | #271 | Tragic 19.8% |
| Immigrants | Ecuador | 0.1 /100 | #272 | Tragic 19.8% |
| Belizeans | 0.1 /100 | #273 | Tragic 19.9% |
| Immigrants | Bangladesh | 0.0 /100 | #274 | Tragic 19.9% |
Demographics Similar to Apache by Child Poverty Among Boys Under 16
In terms of child poverty among boys under 16, the demographic groups most similar to Apache are Black/African American (24.5%, a difference of 0.12%), Immigrants from Dominican Republic (24.3%, a difference of 0.72%), Yup'ik (24.7%, a difference of 0.97%), Dominican (24.2%, a difference of 1.3%), and Colville (24.1%, a difference of 1.7%).
| Demographics | Rating | Rank | Child Poverty Among Boys Under 16 |
| Paiute | 0.0 /100 | #326 | Tragic 22.8% |
| Immigrants | Honduras | 0.0 /100 | #327 | Tragic 22.8% |
| Pueblo | 0.0 /100 | #328 | Tragic 23.5% |
| Natives/Alaskans | 0.0 /100 | #329 | Tragic 24.0% |
| Colville | 0.0 /100 | #330 | Tragic 24.1% |
| Dominicans | 0.0 /100 | #331 | Tragic 24.2% |
| Immigrants | Dominican Republic | 0.0 /100 | #332 | Tragic 24.3% |
| Apache | 0.0 /100 | #333 | Tragic 24.5% |
| Blacks/African Americans | 0.0 /100 | #334 | Tragic 24.5% |
| Yup'ik | 0.0 /100 | #335 | Tragic 24.7% |
| Sioux | 0.0 /100 | #336 | Tragic 25.3% |
| Cheyenne | 0.0 /100 | #337 | Tragic 25.8% |
| Hopi | 0.0 /100 | #338 | Tragic 25.9% |
| Houma | 0.0 /100 | #339 | Tragic 26.2% |
| Crow | 0.0 /100 | #340 | Tragic 26.3% |