U.S. Virgin Islander vs Immigrants from the Azores Male Poverty
COMPARE
U.S. Virgin Islander
Immigrants from the Azores
Male Poverty
Male Poverty Comparison
U.S. Virgin Islanders
Immigrants from the Azores
14.7%
MALE POVERTY
0.0/ 100
METRIC RATING
319th/ 347
METRIC RANK
12.0%
MALE POVERTY
4.3/ 100
METRIC RATING
209th/ 347
METRIC RANK
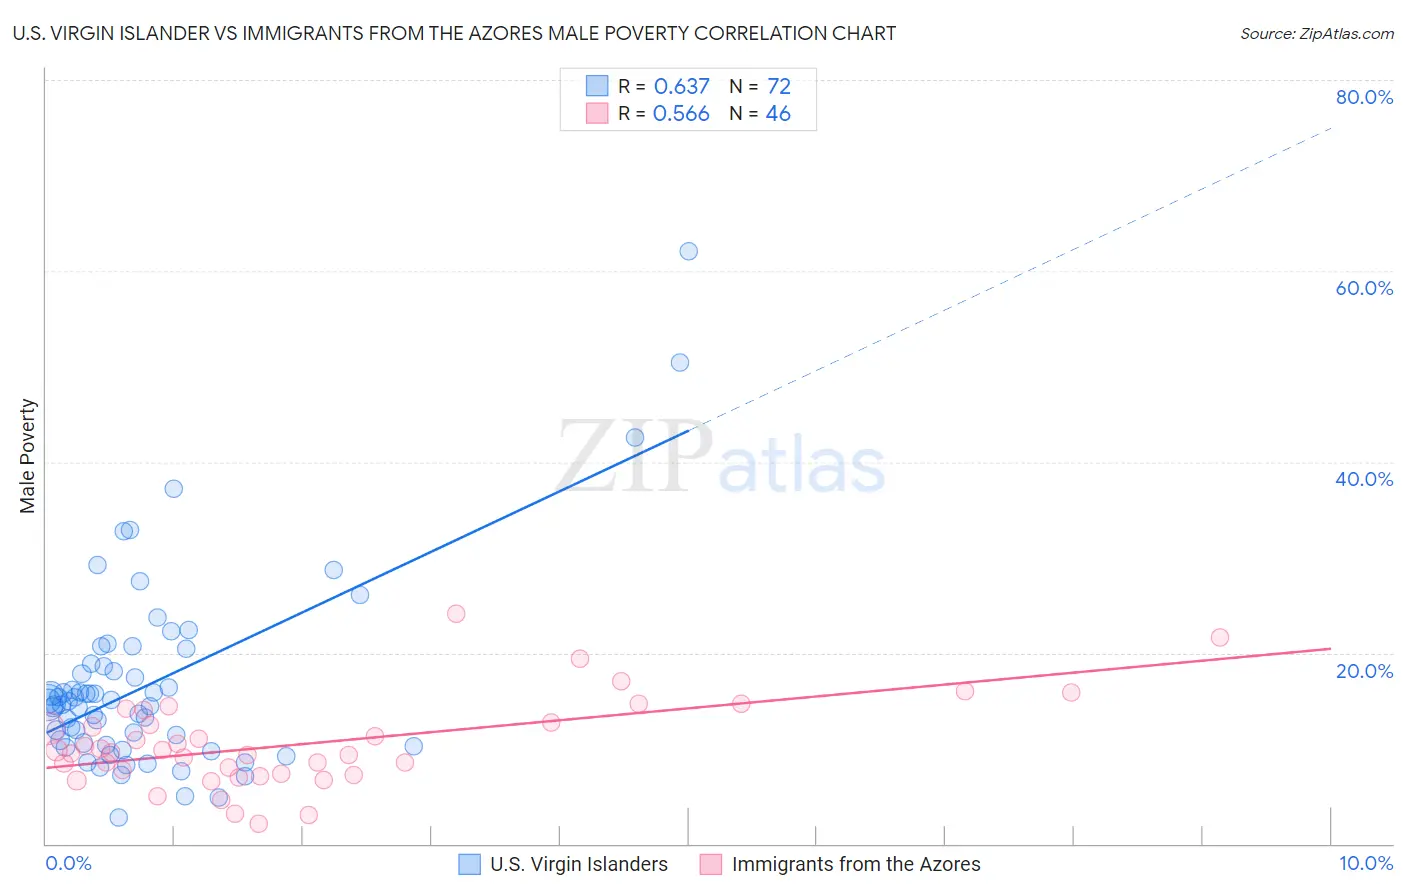
U.S. Virgin Islander vs Immigrants from the Azores Male Poverty Correlation Chart
The statistical analysis conducted on geographies consisting of 87,513,000 people shows a significant positive correlation between the proportion of U.S. Virgin Islanders and poverty level among males in the United States with a correlation coefficient (R) of 0.637 and weighted average of 14.7%. Similarly, the statistical analysis conducted on geographies consisting of 46,252,452 people shows a substantial positive correlation between the proportion of Immigrants from the Azores and poverty level among males in the United States with a correlation coefficient (R) of 0.566 and weighted average of 12.0%, a difference of 22.2%.
Male Poverty Correlation Summary
| Measurement | U.S. Virgin Islander | Immigrants from the Azores |
| Minimum | 2.7% | 2.1% |
| Maximum | 62.0% | 24.1% |
| Range | 59.3% | 21.9% |
| Mean | 16.8% | 10.5% |
| Median | 14.9% | 9.7% |
| Interquartile 25% (IQ1) | 10.4% | 7.3% |
| Interquartile 75% (IQ3) | 18.7% | 12.7% |
| Interquartile Range (IQR) | 8.3% | 5.4% |
| Standard Deviation (Sample) | 10.1% | 4.6% |
| Standard Deviation (Population) | 10.0% | 4.5% |
Similar Demographics by Male Poverty
Demographics Similar to U.S. Virgin Islanders by Male Poverty
In terms of male poverty, the demographic groups most similar to U.S. Virgin Islanders are Immigrants from Grenada (14.7%, a difference of 0.030%), Immigrants from Dominica (14.7%, a difference of 0.090%), Immigrants from Congo (14.7%, a difference of 0.090%), British West Indian (14.6%, a difference of 0.76%), and Chippewa (14.6%, a difference of 0.79%).
| Demographics | Rating | Rank | Male Poverty |
| Choctaw | 0.0 /100 | #312 | Tragic 14.4% |
| Immigrants | Somalia | 0.0 /100 | #313 | Tragic 14.6% |
| Immigrants | Honduras | 0.0 /100 | #314 | Tragic 14.6% |
| Chippewa | 0.0 /100 | #315 | Tragic 14.6% |
| British West Indians | 0.0 /100 | #316 | Tragic 14.6% |
| Immigrants | Dominica | 0.0 /100 | #317 | Tragic 14.7% |
| Immigrants | Grenada | 0.0 /100 | #318 | Tragic 14.7% |
| U.S. Virgin Islanders | 0.0 /100 | #319 | Tragic 14.7% |
| Immigrants | Congo | 0.0 /100 | #320 | Tragic 14.7% |
| Arapaho | 0.0 /100 | #321 | Tragic 15.1% |
| Kiowa | 0.0 /100 | #322 | Tragic 15.2% |
| Colville | 0.0 /100 | #323 | Tragic 15.2% |
| Menominee | 0.0 /100 | #324 | Tragic 15.3% |
| Yakama | 0.0 /100 | #325 | Tragic 15.3% |
| Central American Indians | 0.0 /100 | #326 | Tragic 15.3% |
Demographics Similar to Immigrants from the Azores by Male Poverty
In terms of male poverty, the demographic groups most similar to Immigrants from the Azores are Moroccan (12.0%, a difference of 0.050%), Immigrants (12.0%, a difference of 0.12%), Immigrants from Panama (12.1%, a difference of 0.17%), Malaysian (12.0%, a difference of 0.44%), and Immigrants from Eastern Africa (12.0%, a difference of 0.54%).
| Demographics | Rating | Rank | Male Poverty |
| Aleuts | 10.4 /100 | #202 | Poor 11.8% |
| Immigrants | Western Asia | 9.8 /100 | #203 | Tragic 11.8% |
| Immigrants | Uganda | 8.5 /100 | #204 | Tragic 11.8% |
| Panamanians | 6.2 /100 | #205 | Tragic 11.9% |
| Immigrants | Eastern Africa | 5.4 /100 | #206 | Tragic 12.0% |
| Malaysians | 5.2 /100 | #207 | Tragic 12.0% |
| Immigrants | Immigrants | 4.5 /100 | #208 | Tragic 12.0% |
| Immigrants | Azores | 4.3 /100 | #209 | Tragic 12.0% |
| Moroccans | 4.2 /100 | #210 | Tragic 12.0% |
| Immigrants | Panama | 4.0 /100 | #211 | Tragic 12.1% |
| Americans | 3.2 /100 | #212 | Tragic 12.1% |
| Immigrants | Nonimmigrants | 3.1 /100 | #213 | Tragic 12.1% |
| Japanese | 2.7 /100 | #214 | Tragic 12.2% |
| Immigrants | Uzbekistan | 2.6 /100 | #215 | Tragic 12.2% |
| Immigrants | Cambodia | 2.5 /100 | #216 | Tragic 12.2% |