Choctaw vs Immigrants from Iraq Child Poverty Among Girls Under 16
COMPARE
Choctaw
Immigrants from Iraq
Child Poverty Among Girls Under 16
Child Poverty Among Girls Under 16 Comparison
Choctaw
Immigrants from Iraq
21.1%
CHILD POVERTY AMONG GIRLS UNDER 16
0.0/ 100
METRIC RATING
301st/ 347
METRIC RANK
16.6%
CHILD POVERTY AMONG GIRLS UNDER 16
43.2/ 100
METRIC RATING
181st/ 347
METRIC RANK
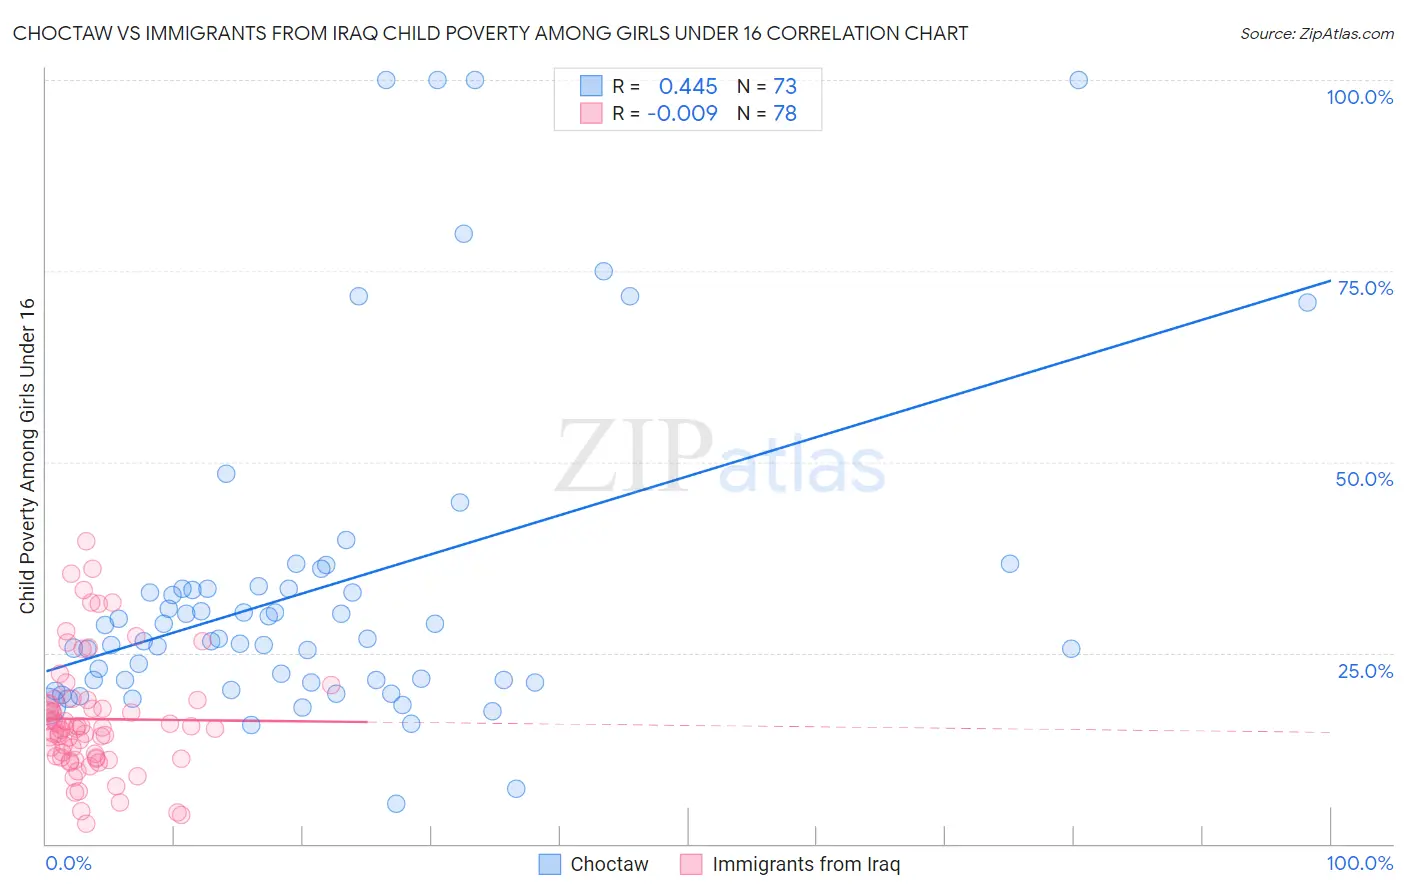
Choctaw vs Immigrants from Iraq Child Poverty Among Girls Under 16 Correlation Chart
The statistical analysis conducted on geographies consisting of 267,369,694 people shows a moderate positive correlation between the proportion of Choctaw and poverty level among girls under the age of 16 in the United States with a correlation coefficient (R) of 0.445 and weighted average of 21.1%. Similarly, the statistical analysis conducted on geographies consisting of 193,254,093 people shows no correlation between the proportion of Immigrants from Iraq and poverty level among girls under the age of 16 in the United States with a correlation coefficient (R) of -0.009 and weighted average of 16.6%, a difference of 27.4%.
Child Poverty Among Girls Under 16 Correlation Summary
| Measurement | Choctaw | Immigrants from Iraq |
| Minimum | 5.3% | 2.6% |
| Maximum | 100.0% | 39.6% |
| Range | 94.7% | 37.1% |
| Mean | 33.5% | 16.3% |
| Median | 26.8% | 15.1% |
| Interquartile 25% (IQ1) | 21.2% | 11.3% |
| Interquartile 75% (IQ3) | 33.4% | 18.8% |
| Interquartile Range (IQR) | 12.2% | 7.5% |
| Standard Deviation (Sample) | 21.5% | 7.8% |
| Standard Deviation (Population) | 21.3% | 7.7% |
Similar Demographics by Child Poverty Among Girls Under 16
Demographics Similar to Choctaw by Child Poverty Among Girls Under 16
In terms of child poverty among girls under 16, the demographic groups most similar to Choctaw are Seminole (21.2%, a difference of 0.12%), British West Indian (21.3%, a difference of 0.57%), Indonesian (21.3%, a difference of 0.60%), Somali (21.0%, a difference of 0.62%), and Hispanic or Latino (21.0%, a difference of 0.93%).
| Demographics | Rating | Rank | Child Poverty Among Girls Under 16 |
| Immigrants | Senegal | 0.0 /100 | #294 | Tragic 20.7% |
| Immigrants | Caribbean | 0.0 /100 | #295 | Tragic 20.7% |
| Immigrants | West Indies | 0.0 /100 | #296 | Tragic 20.7% |
| Inupiat | 0.0 /100 | #297 | Tragic 20.8% |
| Mexicans | 0.0 /100 | #298 | Tragic 20.9% |
| Hispanics or Latinos | 0.0 /100 | #299 | Tragic 21.0% |
| Somalis | 0.0 /100 | #300 | Tragic 21.0% |
| Choctaw | 0.0 /100 | #301 | Tragic 21.1% |
| Seminole | 0.0 /100 | #302 | Tragic 21.2% |
| British West Indians | 0.0 /100 | #303 | Tragic 21.3% |
| Indonesians | 0.0 /100 | #304 | Tragic 21.3% |
| Guatemalans | 0.0 /100 | #305 | Tragic 21.4% |
| Immigrants | Central America | 0.0 /100 | #306 | Tragic 21.4% |
| Immigrants | Bahamas | 0.0 /100 | #307 | Tragic 21.4% |
| Houma | 0.0 /100 | #308 | Tragic 21.5% |
Demographics Similar to Immigrants from Iraq by Child Poverty Among Girls Under 16
In terms of child poverty among girls under 16, the demographic groups most similar to Immigrants from Iraq are Immigrants from Ethiopia (16.6%, a difference of 0.010%), Immigrants from Syria (16.6%, a difference of 0.020%), Hawaiian (16.6%, a difference of 0.030%), White/Caucasian (16.6%, a difference of 0.060%), and Immigrants from Portugal (16.6%, a difference of 0.080%).
| Demographics | Rating | Rank | Child Poverty Among Girls Under 16 |
| Ethiopians | 50.0 /100 | #174 | Average 16.5% |
| Lebanese | 45.4 /100 | #175 | Average 16.6% |
| Hungarians | 45.1 /100 | #176 | Average 16.6% |
| Immigrants | Western Asia | 44.1 /100 | #177 | Average 16.6% |
| Whites/Caucasians | 43.6 /100 | #178 | Average 16.6% |
| Hawaiians | 43.4 /100 | #179 | Average 16.6% |
| Immigrants | Syria | 43.3 /100 | #180 | Average 16.6% |
| Immigrants | Iraq | 43.2 /100 | #181 | Average 16.6% |
| Immigrants | Ethiopia | 43.1 /100 | #182 | Average 16.6% |
| Immigrants | Portugal | 42.5 /100 | #183 | Average 16.6% |
| Scotch-Irish | 39.6 /100 | #184 | Fair 16.7% |
| Immigrants | Uruguay | 35.6 /100 | #185 | Fair 16.7% |
| South American Indians | 35.0 /100 | #186 | Fair 16.8% |
| Immigrants | Morocco | 34.6 /100 | #187 | Fair 16.8% |
| Arabs | 34.5 /100 | #188 | Fair 16.8% |