Uruguayan vs Immigrants from Caribbean In Labor Force | Age 16-19
COMPARE
Uruguayan
Immigrants from Caribbean
In Labor Force | Age 16-19
In Labor Force | Age 16-19 Comparison
Uruguayans
Immigrants from Caribbean
34.9%
IN LABOR FORCE | AGE 16-19
2.6/ 100
METRIC RATING
242nd/ 347
METRIC RANK
31.2%
IN LABOR FORCE | AGE 16-19
0.0/ 100
METRIC RATING
323rd/ 347
METRIC RANK
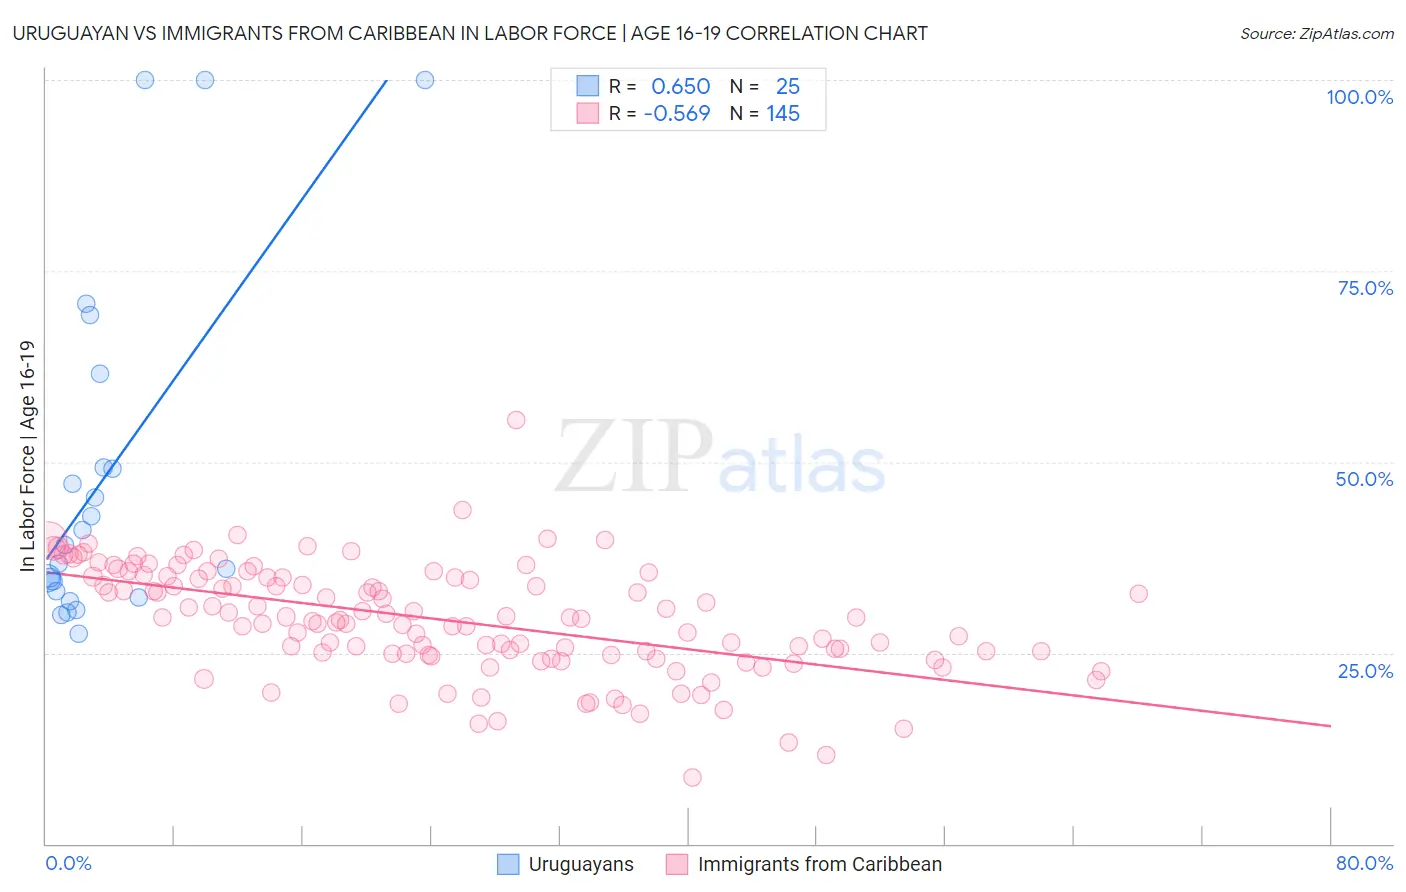
Uruguayan vs Immigrants from Caribbean In Labor Force | Age 16-19 Correlation Chart
The statistical analysis conducted on geographies consisting of 144,711,789 people shows a significant positive correlation between the proportion of Uruguayans and labor force participation rate among population between the ages 16 and 19 in the United States with a correlation coefficient (R) of 0.650 and weighted average of 34.9%. Similarly, the statistical analysis conducted on geographies consisting of 448,967,505 people shows a substantial negative correlation between the proportion of Immigrants from Caribbean and labor force participation rate among population between the ages 16 and 19 in the United States with a correlation coefficient (R) of -0.569 and weighted average of 31.2%, a difference of 11.7%.
In Labor Force | Age 16-19 Correlation Summary
| Measurement | Uruguayan | Immigrants from Caribbean |
| Minimum | 27.5% | 8.6% |
| Maximum | 100.0% | 55.5% |
| Range | 72.5% | 46.9% |
| Mean | 48.3% | 29.4% |
| Median | 39.1% | 29.6% |
| Interquartile 25% (IQ1) | 32.6% | 24.8% |
| Interquartile 75% (IQ3) | 55.3% | 35.0% |
| Interquartile Range (IQR) | 22.7% | 10.1% |
| Standard Deviation (Sample) | 22.7% | 7.2% |
| Standard Deviation (Population) | 22.2% | 7.2% |
Similar Demographics by In Labor Force | Age 16-19
Demographics Similar to Uruguayans by In Labor Force | Age 16-19
In terms of in labor force | age 16-19, the demographic groups most similar to Uruguayans are Pueblo (34.9%, a difference of 0.030%), Immigrants from Turkey (34.9%, a difference of 0.050%), Immigrants from Greece (34.9%, a difference of 0.10%), Immigrants from Ireland (35.0%, a difference of 0.13%), and Immigrants from Sri Lanka (34.9%, a difference of 0.13%).
| Demographics | Rating | Rank | In Labor Force | Age 16-19 |
| Immigrants | Philippines | 4.0 /100 | #235 | Tragic 35.1% |
| Immigrants | Australia | 3.6 /100 | #236 | Tragic 35.1% |
| Immigrants | India | 3.5 /100 | #237 | Tragic 35.0% |
| Immigrants | Vietnam | 3.4 /100 | #238 | Tragic 35.0% |
| Inupiat | 3.2 /100 | #239 | Tragic 35.0% |
| Immigrants | Central America | 3.0 /100 | #240 | Tragic 35.0% |
| Immigrants | Ireland | 2.9 /100 | #241 | Tragic 35.0% |
| Uruguayans | 2.6 /100 | #242 | Tragic 34.9% |
| Pueblo | 2.6 /100 | #243 | Tragic 34.9% |
| Immigrants | Turkey | 2.6 /100 | #244 | Tragic 34.9% |
| Immigrants | Greece | 2.4 /100 | #245 | Tragic 34.9% |
| Immigrants | Sri Lanka | 2.4 /100 | #246 | Tragic 34.9% |
| Laotians | 2.4 /100 | #247 | Tragic 34.9% |
| Central Americans | 2.2 /100 | #248 | Tragic 34.8% |
| Immigrants | Ukraine | 2.2 /100 | #249 | Tragic 34.8% |
Demographics Similar to Immigrants from Caribbean by In Labor Force | Age 16-19
In terms of in labor force | age 16-19, the demographic groups most similar to Immigrants from Caribbean are Tohono O'odham (31.3%, a difference of 0.13%), Dominican (31.2%, a difference of 0.18%), West Indian (31.3%, a difference of 0.25%), Immigrants from China (31.1%, a difference of 0.33%), and Ecuadorian (31.4%, a difference of 0.48%).
| Demographics | Rating | Rank | In Labor Force | Age 16-19 |
| Filipinos | 0.0 /100 | #316 | Tragic 31.7% |
| Immigrants | Nicaragua | 0.0 /100 | #317 | Tragic 31.6% |
| Immigrants | Yemen | 0.0 /100 | #318 | Tragic 31.5% |
| Soviet Union | 0.0 /100 | #319 | Tragic 31.4% |
| Ecuadorians | 0.0 /100 | #320 | Tragic 31.4% |
| West Indians | 0.0 /100 | #321 | Tragic 31.3% |
| Tohono O'odham | 0.0 /100 | #322 | Tragic 31.3% |
| Immigrants | Caribbean | 0.0 /100 | #323 | Tragic 31.2% |
| Dominicans | 0.0 /100 | #324 | Tragic 31.2% |
| Immigrants | China | 0.0 /100 | #325 | Tragic 31.1% |
| Immigrants | Dominican Republic | 0.0 /100 | #326 | Tragic 31.1% |
| Immigrants | Taiwan | 0.0 /100 | #327 | Tragic 31.0% |
| Immigrants | Ecuador | 0.0 /100 | #328 | Tragic 31.0% |
| Barbadians | 0.0 /100 | #329 | Tragic 31.0% |
| Lumbee | 0.0 /100 | #330 | Tragic 31.0% |