Uruguayan vs British Male Poverty
COMPARE
Uruguayan
British
Male Poverty
Male Poverty Comparison
Uruguayans
British
11.2%
MALE POVERTY
51.0/ 100
METRIC RATING
171st/ 347
METRIC RANK
10.4%
MALE POVERTY
94.8/ 100
METRIC RATING
91st/ 347
METRIC RANK
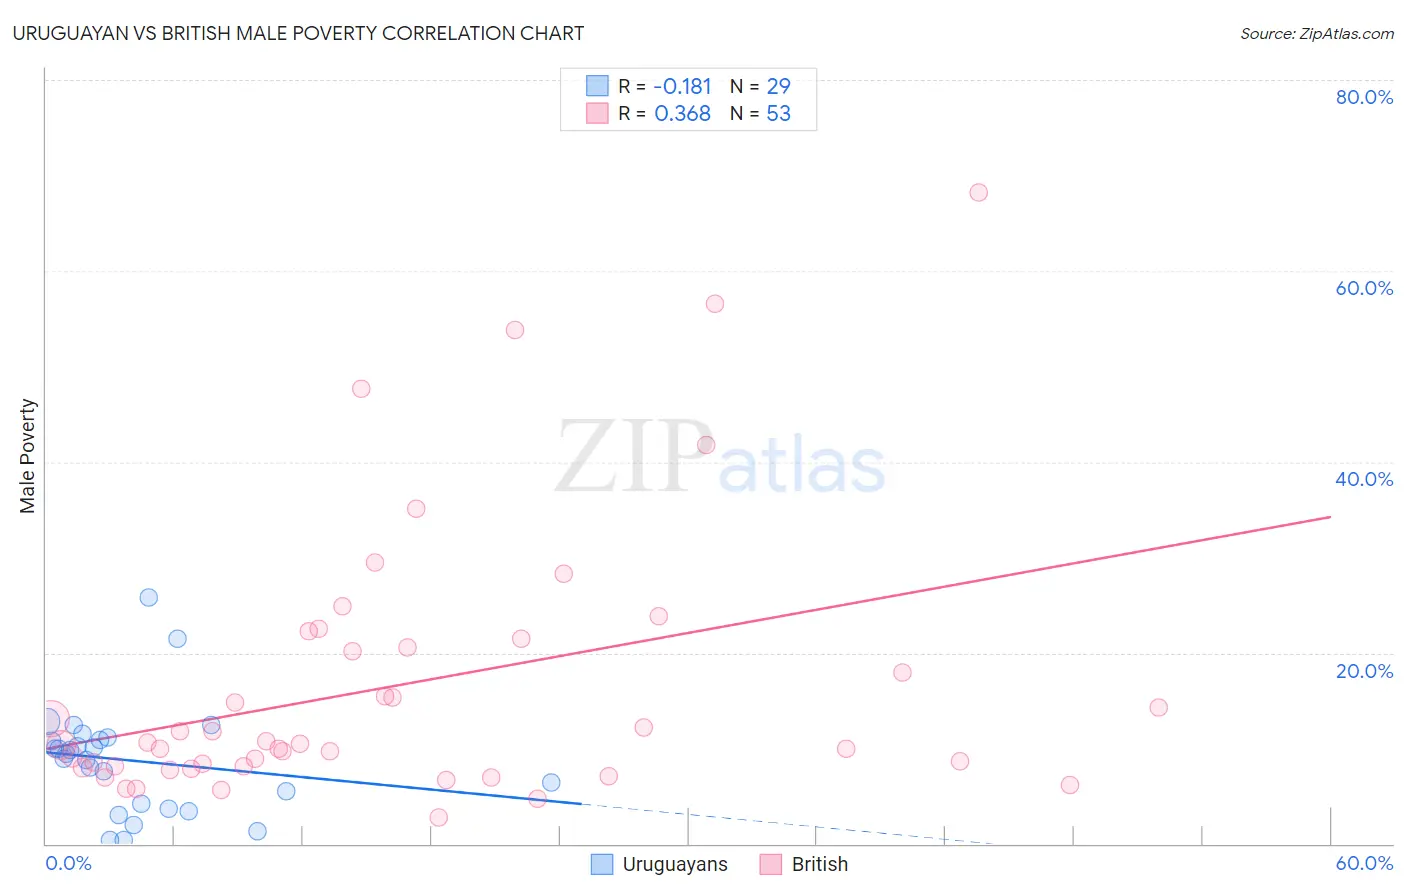
Uruguayan vs British Male Poverty Correlation Chart
The statistical analysis conducted on geographies consisting of 144,748,239 people shows a poor negative correlation between the proportion of Uruguayans and poverty level among males in the United States with a correlation coefficient (R) of -0.181 and weighted average of 11.2%. Similarly, the statistical analysis conducted on geographies consisting of 530,450,397 people shows a mild positive correlation between the proportion of British and poverty level among males in the United States with a correlation coefficient (R) of 0.368 and weighted average of 10.4%, a difference of 7.5%.
Male Poverty Correlation Summary
| Measurement | Uruguayan | British |
| Minimum | 0.34% | 2.8% |
| Maximum | 25.8% | 68.2% |
| Range | 25.4% | 65.4% |
| Mean | 8.7% | 16.5% |
| Median | 9.5% | 10.4% |
| Interquartile 25% (IQ1) | 3.9% | 8.0% |
| Interquartile 75% (IQ3) | 11.0% | 21.0% |
| Interquartile Range (IQR) | 7.0% | 13.0% |
| Standard Deviation (Sample) | 5.6% | 14.2% |
| Standard Deviation (Population) | 5.5% | 14.0% |
Similar Demographics by Male Poverty
Demographics Similar to Uruguayans by Male Poverty
In terms of male poverty, the demographic groups most similar to Uruguayans are Immigrants from Ethiopia (11.2%, a difference of 0.040%), Pennsylvania German (11.2%, a difference of 0.060%), Immigrants from Oceania (11.2%, a difference of 0.10%), South American (11.1%, a difference of 0.27%), and Immigrants from Colombia (11.1%, a difference of 0.31%).
| Demographics | Rating | Rank | Male Poverty |
| Ethiopians | 56.7 /100 | #164 | Average 11.1% |
| Immigrants | Spain | 55.5 /100 | #165 | Average 11.1% |
| Immigrants | Albania | 55.3 /100 | #166 | Average 11.1% |
| Hungarians | 55.1 /100 | #167 | Average 11.1% |
| Immigrants | Portugal | 54.9 /100 | #168 | Average 11.1% |
| Immigrants | Colombia | 54.2 /100 | #169 | Average 11.1% |
| South Americans | 53.8 /100 | #170 | Average 11.1% |
| Uruguayans | 51.0 /100 | #171 | Average 11.2% |
| Immigrants | Ethiopia | 50.7 /100 | #172 | Average 11.2% |
| Pennsylvania Germans | 50.5 /100 | #173 | Average 11.2% |
| Immigrants | Oceania | 50.0 /100 | #174 | Average 11.2% |
| Celtics | 47.5 /100 | #175 | Average 11.2% |
| Immigrants | Fiji | 46.0 /100 | #176 | Average 11.2% |
| Lebanese | 45.6 /100 | #177 | Average 11.2% |
| Immigrants | Cameroon | 44.5 /100 | #178 | Average 11.2% |
Demographics Similar to British by Male Poverty
In terms of male poverty, the demographic groups most similar to British are Indian (Asian) (10.4%, a difference of 0.070%), Immigrants from Denmark (10.4%, a difference of 0.090%), Cambodian (10.4%, a difference of 0.10%), Jordanian (10.4%, a difference of 0.20%), and Australian (10.4%, a difference of 0.20%).
| Demographics | Rating | Rank | Male Poverty |
| Czechoslovakians | 95.6 /100 | #84 | Exceptional 10.3% |
| Immigrants | England | 95.5 /100 | #85 | Exceptional 10.4% |
| Immigrants | Eastern Asia | 95.3 /100 | #86 | Exceptional 10.4% |
| Northern Europeans | 95.2 /100 | #87 | Exceptional 10.4% |
| Cambodians | 95.0 /100 | #88 | Exceptional 10.4% |
| Immigrants | Denmark | 95.0 /100 | #89 | Exceptional 10.4% |
| Indians (Asian) | 94.9 /100 | #90 | Exceptional 10.4% |
| British | 94.8 /100 | #91 | Exceptional 10.4% |
| Jordanians | 94.4 /100 | #92 | Exceptional 10.4% |
| Australians | 94.4 /100 | #93 | Exceptional 10.4% |
| Immigrants | South Africa | 94.1 /100 | #94 | Exceptional 10.4% |
| Scottish | 94.0 /100 | #95 | Exceptional 10.4% |
| Immigrants | Egypt | 93.7 /100 | #96 | Exceptional 10.4% |
| Romanians | 93.6 /100 | #97 | Exceptional 10.5% |
| Finns | 93.4 /100 | #98 | Exceptional 10.5% |