Uruguayan vs British Divorced or Separated
COMPARE
Uruguayan
British
Divorced or Separated
Divorced or Separated Comparison
Uruguayans
British
12.4%
DIVORCED OR SEPARATED
3.4/ 100
METRIC RATING
241st/ 347
METRIC RANK
12.3%
DIVORCED OR SEPARATED
11.6/ 100
METRIC RATING
220th/ 347
METRIC RANK
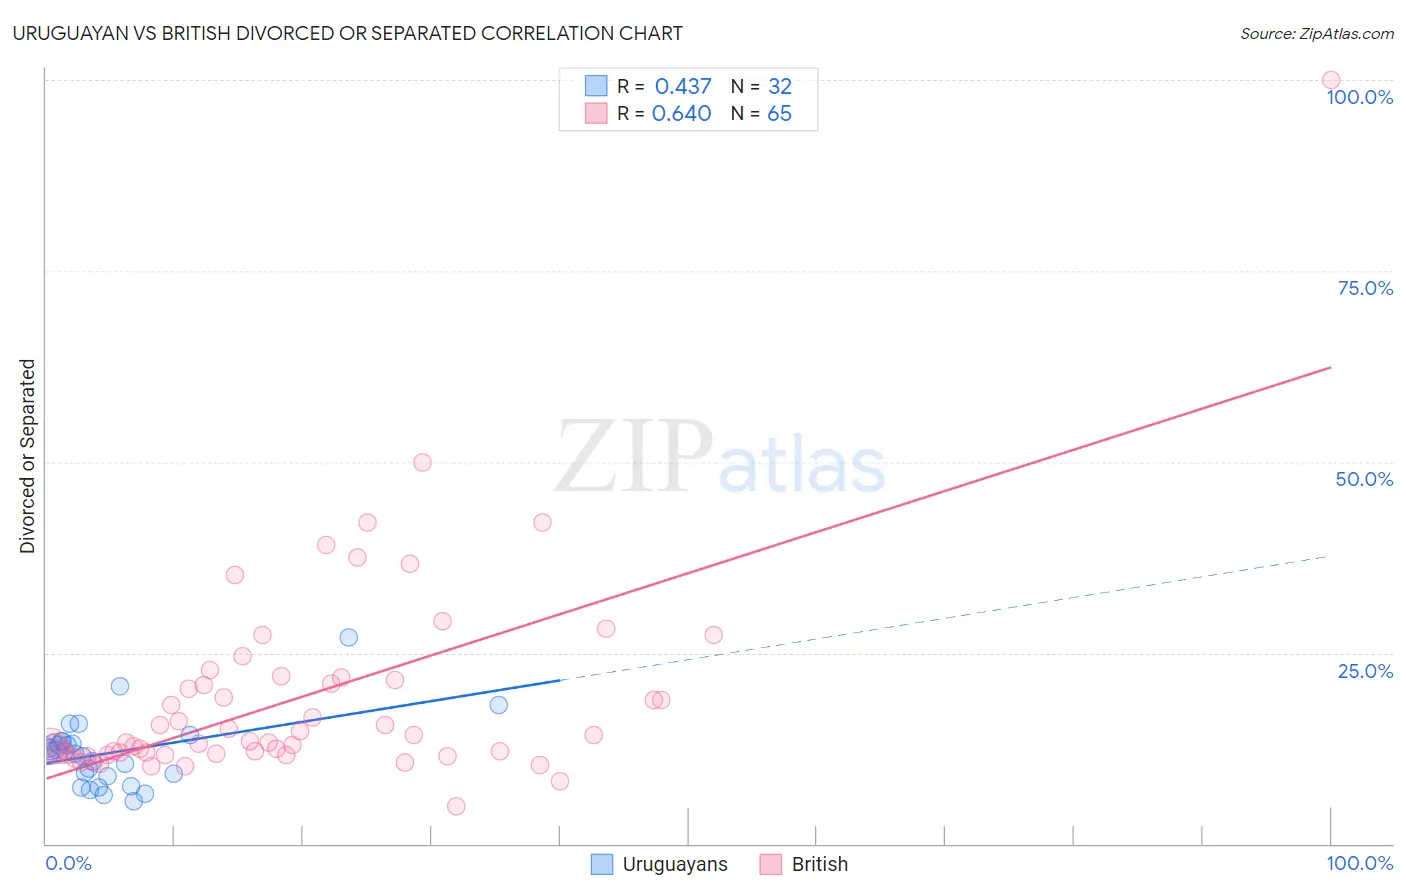
Uruguayan vs British Divorced or Separated Correlation Chart
The statistical analysis conducted on geographies consisting of 144,765,430 people shows a moderate positive correlation between the proportion of Uruguayans and percentage of population currently divorced or separated in the United States with a correlation coefficient (R) of 0.437 and weighted average of 12.4%. Similarly, the statistical analysis conducted on geographies consisting of 531,128,127 people shows a significant positive correlation between the proportion of British and percentage of population currently divorced or separated in the United States with a correlation coefficient (R) of 0.640 and weighted average of 12.3%, a difference of 1.1%.
Divorced or Separated Correlation Summary
| Measurement | Uruguayan | British |
| Minimum | 5.6% | 4.9% |
| Maximum | 27.0% | 100.0% |
| Range | 21.4% | 95.1% |
| Mean | 11.9% | 19.2% |
| Median | 12.1% | 13.4% |
| Interquartile 25% (IQ1) | 9.0% | 11.8% |
| Interquartile 75% (IQ3) | 13.3% | 21.6% |
| Interquartile Range (IQR) | 4.3% | 9.8% |
| Standard Deviation (Sample) | 4.4% | 13.9% |
| Standard Deviation (Population) | 4.3% | 13.8% |
Similar Demographics by Divorced or Separated
Demographics Similar to Uruguayans by Divorced or Separated
In terms of divorced or separated, the demographic groups most similar to Uruguayans are British West Indian (12.4%, a difference of 0.090%), Dutch (12.4%, a difference of 0.090%), Immigrants from Germany (12.4%, a difference of 0.14%), Sudanese (12.4%, a difference of 0.15%), and Immigrants from Latin America (12.4%, a difference of 0.15%).
| Demographics | Rating | Rank | Divorced or Separated |
| West Indians | 4.4 /100 | #234 | Tragic 12.4% |
| Immigrants | Bosnia and Herzegovina | 4.3 /100 | #235 | Tragic 12.4% |
| Colombians | 4.2 /100 | #236 | Tragic 12.4% |
| Immigrants | Laos | 4.2 /100 | #237 | Tragic 12.4% |
| Sudanese | 4.0 /100 | #238 | Tragic 12.4% |
| Immigrants | Germany | 4.0 /100 | #239 | Tragic 12.4% |
| British West Indians | 3.7 /100 | #240 | Tragic 12.4% |
| Uruguayans | 3.4 /100 | #241 | Tragic 12.4% |
| Dutch | 3.1 /100 | #242 | Tragic 12.4% |
| Immigrants | Latin America | 2.8 /100 | #243 | Tragic 12.4% |
| Alaska Natives | 2.5 /100 | #244 | Tragic 12.4% |
| Hispanics or Latinos | 2.0 /100 | #245 | Tragic 12.5% |
| Immigrants | West Indies | 1.9 /100 | #246 | Tragic 12.5% |
| Germans | 1.8 /100 | #247 | Tragic 12.5% |
| Nepalese | 1.8 /100 | #248 | Tragic 12.5% |
Demographics Similar to British by Divorced or Separated
In terms of divorced or separated, the demographic groups most similar to British are Czechoslovakian (12.3%, a difference of 0.010%), Guamanian/Chamorro (12.3%, a difference of 0.030%), Bangladeshi (12.3%, a difference of 0.10%), Scandinavian (12.3%, a difference of 0.11%), and Slovene (12.3%, a difference of 0.12%).
| Demographics | Rating | Rank | Divorced or Separated |
| Immigrants | Eastern Africa | 16.2 /100 | #213 | Poor 12.2% |
| Immigrants | Argentina | 15.5 /100 | #214 | Poor 12.2% |
| Europeans | 15.4 /100 | #215 | Poor 12.2% |
| Immigrants | South America | 15.4 /100 | #216 | Poor 12.2% |
| Northern Europeans | 14.7 /100 | #217 | Poor 12.2% |
| Slovenes | 13.2 /100 | #218 | Poor 12.3% |
| Czechoslovakians | 11.7 /100 | #219 | Poor 12.3% |
| British | 11.6 /100 | #220 | Poor 12.3% |
| Guamanians/Chamorros | 11.3 /100 | #221 | Poor 12.3% |
| Bangladeshis | 10.5 /100 | #222 | Poor 12.3% |
| Scandinavians | 10.4 /100 | #223 | Poor 12.3% |
| Immigrants | Azores | 9.7 /100 | #224 | Tragic 12.3% |
| Belgians | 9.7 /100 | #225 | Tragic 12.3% |
| Immigrants | Western Africa | 9.3 /100 | #226 | Tragic 12.3% |
| Hmong | 8.8 /100 | #227 | Tragic 12.3% |