Uruguayan vs German Russian Male Poverty
COMPARE
Uruguayan
German Russian
Male Poverty
Male Poverty Comparison
Uruguayans
German Russians
11.2%
MALE POVERTY
51.0/ 100
METRIC RATING
171st/ 347
METRIC RANK
12.2%
MALE POVERTY
2.5/ 100
METRIC RATING
218th/ 347
METRIC RANK
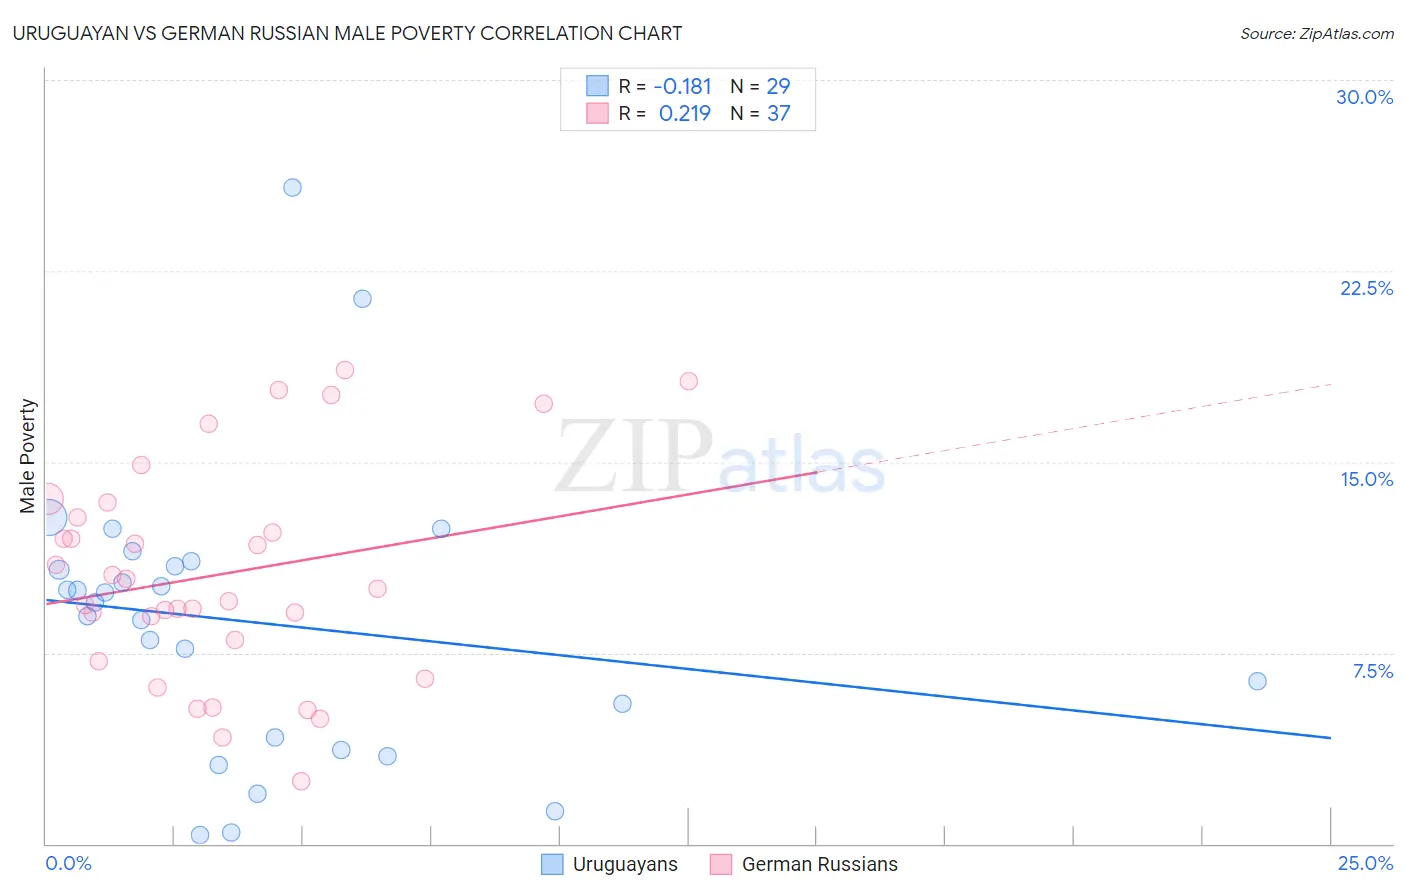
Uruguayan vs German Russian Male Poverty Correlation Chart
The statistical analysis conducted on geographies consisting of 144,748,239 people shows a poor negative correlation between the proportion of Uruguayans and poverty level among males in the United States with a correlation coefficient (R) of -0.181 and weighted average of 11.2%. Similarly, the statistical analysis conducted on geographies consisting of 96,430,864 people shows a weak positive correlation between the proportion of German Russians and poverty level among males in the United States with a correlation coefficient (R) of 0.219 and weighted average of 12.2%, a difference of 9.1%.
Male Poverty Correlation Summary
| Measurement | Uruguayan | German Russian |
| Minimum | 0.34% | 2.5% |
| Maximum | 25.8% | 18.6% |
| Range | 25.4% | 16.2% |
| Mean | 8.7% | 10.6% |
| Median | 9.5% | 10.0% |
| Interquartile 25% (IQ1) | 3.9% | 7.6% |
| Interquartile 75% (IQ3) | 11.0% | 13.1% |
| Interquartile Range (IQR) | 7.0% | 5.5% |
| Standard Deviation (Sample) | 5.6% | 4.2% |
| Standard Deviation (Population) | 5.5% | 4.2% |
Similar Demographics by Male Poverty
Demographics Similar to Uruguayans by Male Poverty
In terms of male poverty, the demographic groups most similar to Uruguayans are Immigrants from Ethiopia (11.2%, a difference of 0.040%), Pennsylvania German (11.2%, a difference of 0.060%), Immigrants from Oceania (11.2%, a difference of 0.10%), South American (11.1%, a difference of 0.27%), and Immigrants from Colombia (11.1%, a difference of 0.31%).
| Demographics | Rating | Rank | Male Poverty |
| Ethiopians | 56.7 /100 | #164 | Average 11.1% |
| Immigrants | Spain | 55.5 /100 | #165 | Average 11.1% |
| Immigrants | Albania | 55.3 /100 | #166 | Average 11.1% |
| Hungarians | 55.1 /100 | #167 | Average 11.1% |
| Immigrants | Portugal | 54.9 /100 | #168 | Average 11.1% |
| Immigrants | Colombia | 54.2 /100 | #169 | Average 11.1% |
| South Americans | 53.8 /100 | #170 | Average 11.1% |
| Uruguayans | 51.0 /100 | #171 | Average 11.2% |
| Immigrants | Ethiopia | 50.7 /100 | #172 | Average 11.2% |
| Pennsylvania Germans | 50.5 /100 | #173 | Average 11.2% |
| Immigrants | Oceania | 50.0 /100 | #174 | Average 11.2% |
| Celtics | 47.5 /100 | #175 | Average 11.2% |
| Immigrants | Fiji | 46.0 /100 | #176 | Average 11.2% |
| Lebanese | 45.6 /100 | #177 | Average 11.2% |
| Immigrants | Cameroon | 44.5 /100 | #178 | Average 11.2% |
Demographics Similar to German Russians by Male Poverty
In terms of male poverty, the demographic groups most similar to German Russians are Immigrants from Thailand (12.2%, a difference of 0.020%), Immigrants from Cambodia (12.2%, a difference of 0.030%), Bermudan (12.2%, a difference of 0.070%), Immigrants from Eritrea (12.2%, a difference of 0.080%), and Immigrants from Uzbekistan (12.2%, a difference of 0.11%).
| Demographics | Rating | Rank | Male Poverty |
| Immigrants | Panama | 4.0 /100 | #211 | Tragic 12.1% |
| Americans | 3.2 /100 | #212 | Tragic 12.1% |
| Immigrants | Nonimmigrants | 3.1 /100 | #213 | Tragic 12.1% |
| Japanese | 2.7 /100 | #214 | Tragic 12.2% |
| Immigrants | Uzbekistan | 2.6 /100 | #215 | Tragic 12.2% |
| Immigrants | Cambodia | 2.5 /100 | #216 | Tragic 12.2% |
| Immigrants | Thailand | 2.5 /100 | #217 | Tragic 12.2% |
| German Russians | 2.5 /100 | #218 | Tragic 12.2% |
| Bermudans | 2.4 /100 | #219 | Tragic 12.2% |
| Immigrants | Eritrea | 2.4 /100 | #220 | Tragic 12.2% |
| Ugandans | 2.2 /100 | #221 | Tragic 12.2% |
| Immigrants | Africa | 2.1 /100 | #222 | Tragic 12.2% |
| Immigrants | Micronesia | 2.1 /100 | #223 | Tragic 12.2% |
| Immigrants | Nigeria | 1.6 /100 | #224 | Tragic 12.3% |
| Osage | 1.5 /100 | #225 | Tragic 12.3% |