Uruguayan vs Paiute Male Poverty
COMPARE
Uruguayan
Paiute
Male Poverty
Male Poverty Comparison
Uruguayans
Paiute
11.2%
MALE POVERTY
51.0/ 100
METRIC RATING
171st/ 347
METRIC RANK
15.8%
MALE POVERTY
0.0/ 100
METRIC RATING
327th/ 347
METRIC RANK
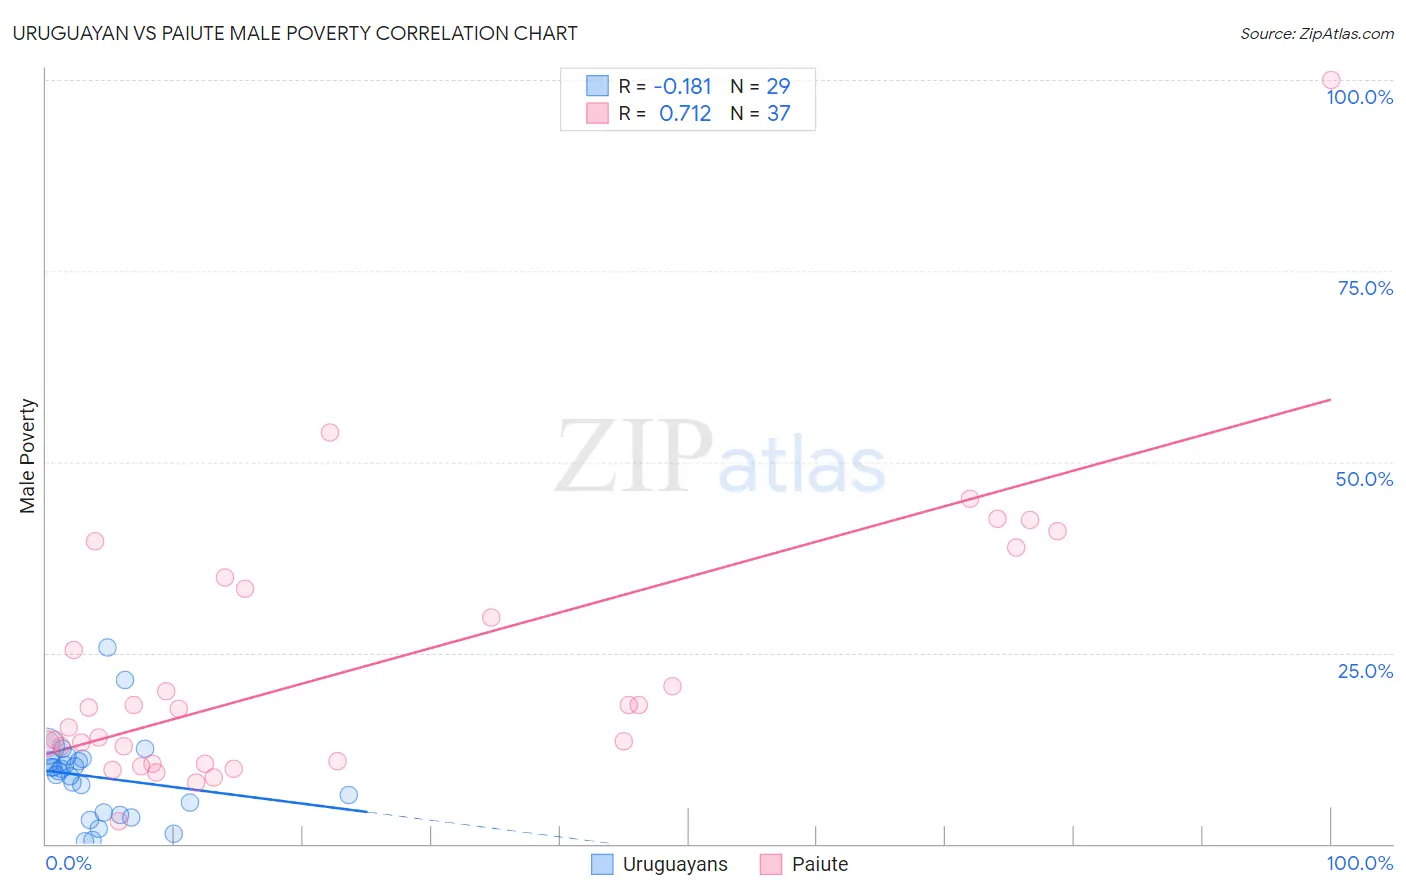
Uruguayan vs Paiute Male Poverty Correlation Chart
The statistical analysis conducted on geographies consisting of 144,748,239 people shows a poor negative correlation between the proportion of Uruguayans and poverty level among males in the United States with a correlation coefficient (R) of -0.181 and weighted average of 11.2%. Similarly, the statistical analysis conducted on geographies consisting of 58,389,257 people shows a strong positive correlation between the proportion of Paiute and poverty level among males in the United States with a correlation coefficient (R) of 0.712 and weighted average of 15.8%, a difference of 41.4%.
Male Poverty Correlation Summary
| Measurement | Uruguayan | Paiute |
| Minimum | 0.34% | 2.9% |
| Maximum | 25.8% | 100.0% |
| Range | 25.4% | 97.1% |
| Mean | 8.7% | 23.1% |
| Median | 9.5% | 17.8% |
| Interquartile 25% (IQ1) | 3.9% | 10.6% |
| Interquartile 75% (IQ3) | 11.0% | 34.1% |
| Interquartile Range (IQR) | 7.0% | 23.5% |
| Standard Deviation (Sample) | 5.6% | 18.4% |
| Standard Deviation (Population) | 5.5% | 18.1% |
Similar Demographics by Male Poverty
Demographics Similar to Uruguayans by Male Poverty
In terms of male poverty, the demographic groups most similar to Uruguayans are Immigrants from Ethiopia (11.2%, a difference of 0.040%), Pennsylvania German (11.2%, a difference of 0.060%), Immigrants from Oceania (11.2%, a difference of 0.10%), South American (11.1%, a difference of 0.27%), and Immigrants from Colombia (11.1%, a difference of 0.31%).
| Demographics | Rating | Rank | Male Poverty |
| Ethiopians | 56.7 /100 | #164 | Average 11.1% |
| Immigrants | Spain | 55.5 /100 | #165 | Average 11.1% |
| Immigrants | Albania | 55.3 /100 | #166 | Average 11.1% |
| Hungarians | 55.1 /100 | #167 | Average 11.1% |
| Immigrants | Portugal | 54.9 /100 | #168 | Average 11.1% |
| Immigrants | Colombia | 54.2 /100 | #169 | Average 11.1% |
| South Americans | 53.8 /100 | #170 | Average 11.1% |
| Uruguayans | 51.0 /100 | #171 | Average 11.2% |
| Immigrants | Ethiopia | 50.7 /100 | #172 | Average 11.2% |
| Pennsylvania Germans | 50.5 /100 | #173 | Average 11.2% |
| Immigrants | Oceania | 50.0 /100 | #174 | Average 11.2% |
| Celtics | 47.5 /100 | #175 | Average 11.2% |
| Immigrants | Fiji | 46.0 /100 | #176 | Average 11.2% |
| Lebanese | 45.6 /100 | #177 | Average 11.2% |
| Immigrants | Cameroon | 44.5 /100 | #178 | Average 11.2% |
Demographics Similar to Paiute by Male Poverty
In terms of male poverty, the demographic groups most similar to Paiute are Black/African American (15.8%, a difference of 0.060%), Dominican (16.1%, a difference of 1.8%), Immigrants from Dominican Republic (16.2%, a difference of 2.4%), Ute (16.2%, a difference of 2.8%), and Central American Indian (15.3%, a difference of 3.1%).
| Demographics | Rating | Rank | Male Poverty |
| Immigrants | Congo | 0.0 /100 | #320 | Tragic 14.7% |
| Arapaho | 0.0 /100 | #321 | Tragic 15.1% |
| Kiowa | 0.0 /100 | #322 | Tragic 15.2% |
| Colville | 0.0 /100 | #323 | Tragic 15.2% |
| Menominee | 0.0 /100 | #324 | Tragic 15.3% |
| Yakama | 0.0 /100 | #325 | Tragic 15.3% |
| Central American Indians | 0.0 /100 | #326 | Tragic 15.3% |
| Paiute | 0.0 /100 | #327 | Tragic 15.8% |
| Blacks/African Americans | 0.0 /100 | #328 | Tragic 15.8% |
| Dominicans | 0.0 /100 | #329 | Tragic 16.1% |
| Immigrants | Dominican Republic | 0.0 /100 | #330 | Tragic 16.2% |
| Ute | 0.0 /100 | #331 | Tragic 16.2% |
| Houma | 0.0 /100 | #332 | Tragic 16.7% |
| Natives/Alaskans | 0.0 /100 | #333 | Tragic 16.9% |
| Cheyenne | 0.0 /100 | #334 | Tragic 17.6% |