Immigrants from Latvia vs British Male Poverty
COMPARE
Immigrants from Latvia
British
Male Poverty
Male Poverty Comparison
Immigrants from Latvia
British
10.5%
MALE POVERTY
92.8/ 100
METRIC RATING
100th/ 347
METRIC RANK
10.4%
MALE POVERTY
94.8/ 100
METRIC RATING
91st/ 347
METRIC RANK
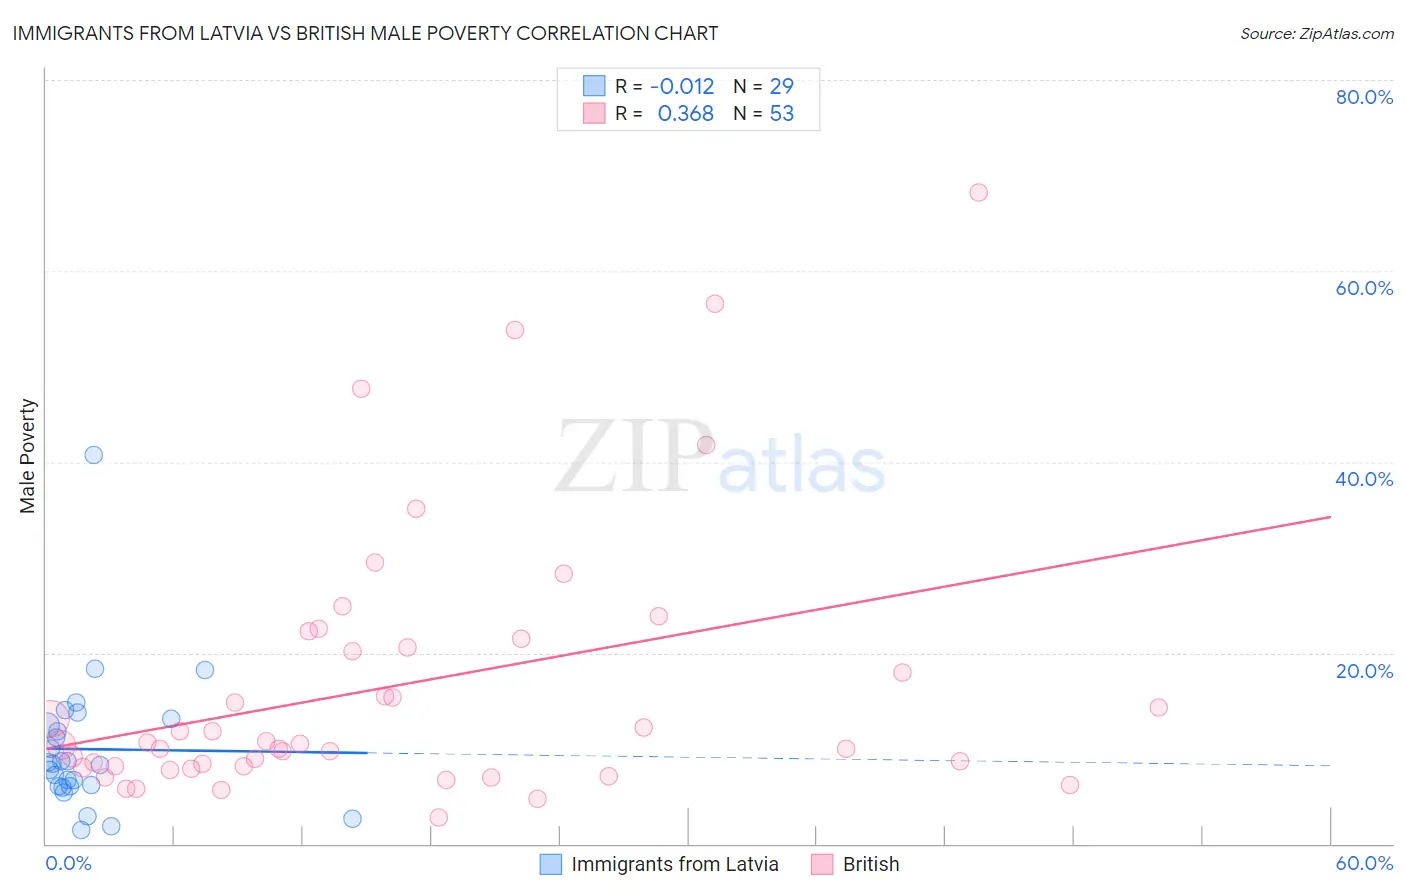
Immigrants from Latvia vs British Male Poverty Correlation Chart
The statistical analysis conducted on geographies consisting of 113,727,577 people shows no correlation between the proportion of Immigrants from Latvia and poverty level among males in the United States with a correlation coefficient (R) of -0.012 and weighted average of 10.5%. Similarly, the statistical analysis conducted on geographies consisting of 530,450,397 people shows a mild positive correlation between the proportion of British and poverty level among males in the United States with a correlation coefficient (R) of 0.368 and weighted average of 10.4%, a difference of 0.93%.
Male Poverty Correlation Summary
| Measurement | Immigrants from Latvia | British |
| Minimum | 1.5% | 2.8% |
| Maximum | 40.7% | 68.2% |
| Range | 39.2% | 65.4% |
| Mean | 9.9% | 16.5% |
| Median | 8.3% | 10.4% |
| Interquartile 25% (IQ1) | 6.1% | 8.0% |
| Interquartile 75% (IQ3) | 12.8% | 21.0% |
| Interquartile Range (IQR) | 6.7% | 13.0% |
| Standard Deviation (Sample) | 7.4% | 14.2% |
| Standard Deviation (Population) | 7.2% | 14.0% |
Demographics Similar to Immigrants from Latvia and British by Male Poverty
In terms of male poverty, the demographic groups most similar to Immigrants from Latvia are Immigrants from Indonesia (10.5%, a difference of 0.21%), Finnish (10.5%, a difference of 0.28%), Immigrants from Zimbabwe (10.5%, a difference of 0.29%), French Canadian (10.5%, a difference of 0.30%), and Romanian (10.5%, a difference of 0.34%). Similarly, the demographic groups most similar to British are Indian (Asian) (10.4%, a difference of 0.070%), Immigrants from Denmark (10.4%, a difference of 0.090%), Cambodian (10.4%, a difference of 0.10%), Jordanian (10.4%, a difference of 0.20%), and Australian (10.4%, a difference of 0.20%).
| Demographics | Rating | Rank | Male Poverty |
| Immigrants | England | 95.5 /100 | #85 | Exceptional 10.4% |
| Immigrants | Eastern Asia | 95.3 /100 | #86 | Exceptional 10.4% |
| Northern Europeans | 95.2 /100 | #87 | Exceptional 10.4% |
| Cambodians | 95.0 /100 | #88 | Exceptional 10.4% |
| Immigrants | Denmark | 95.0 /100 | #89 | Exceptional 10.4% |
| Indians (Asian) | 94.9 /100 | #90 | Exceptional 10.4% |
| British | 94.8 /100 | #91 | Exceptional 10.4% |
| Jordanians | 94.4 /100 | #92 | Exceptional 10.4% |
| Australians | 94.4 /100 | #93 | Exceptional 10.4% |
| Immigrants | South Africa | 94.1 /100 | #94 | Exceptional 10.4% |
| Scottish | 94.0 /100 | #95 | Exceptional 10.4% |
| Immigrants | Egypt | 93.7 /100 | #96 | Exceptional 10.4% |
| Romanians | 93.6 /100 | #97 | Exceptional 10.5% |
| Finns | 93.4 /100 | #98 | Exceptional 10.5% |
| Immigrants | Indonesia | 93.3 /100 | #99 | Exceptional 10.5% |
| Immigrants | Latvia | 92.8 /100 | #100 | Exceptional 10.5% |
| Immigrants | Zimbabwe | 92.0 /100 | #101 | Exceptional 10.5% |
| French Canadians | 91.9 /100 | #102 | Exceptional 10.5% |
| Slavs | 91.7 /100 | #103 | Exceptional 10.5% |
| Welsh | 91.6 /100 | #104 | Exceptional 10.5% |
| Canadians | 91.6 /100 | #105 | Exceptional 10.5% |