Immigrants from North America vs British Male Poverty
COMPARE
Immigrants from North America
British
Male Poverty
Male Poverty Comparison
Immigrants from North America
British
10.3%
MALE POVERTY
96.5/ 100
METRIC RATING
79th/ 347
METRIC RANK
10.4%
MALE POVERTY
94.8/ 100
METRIC RATING
91st/ 347
METRIC RANK
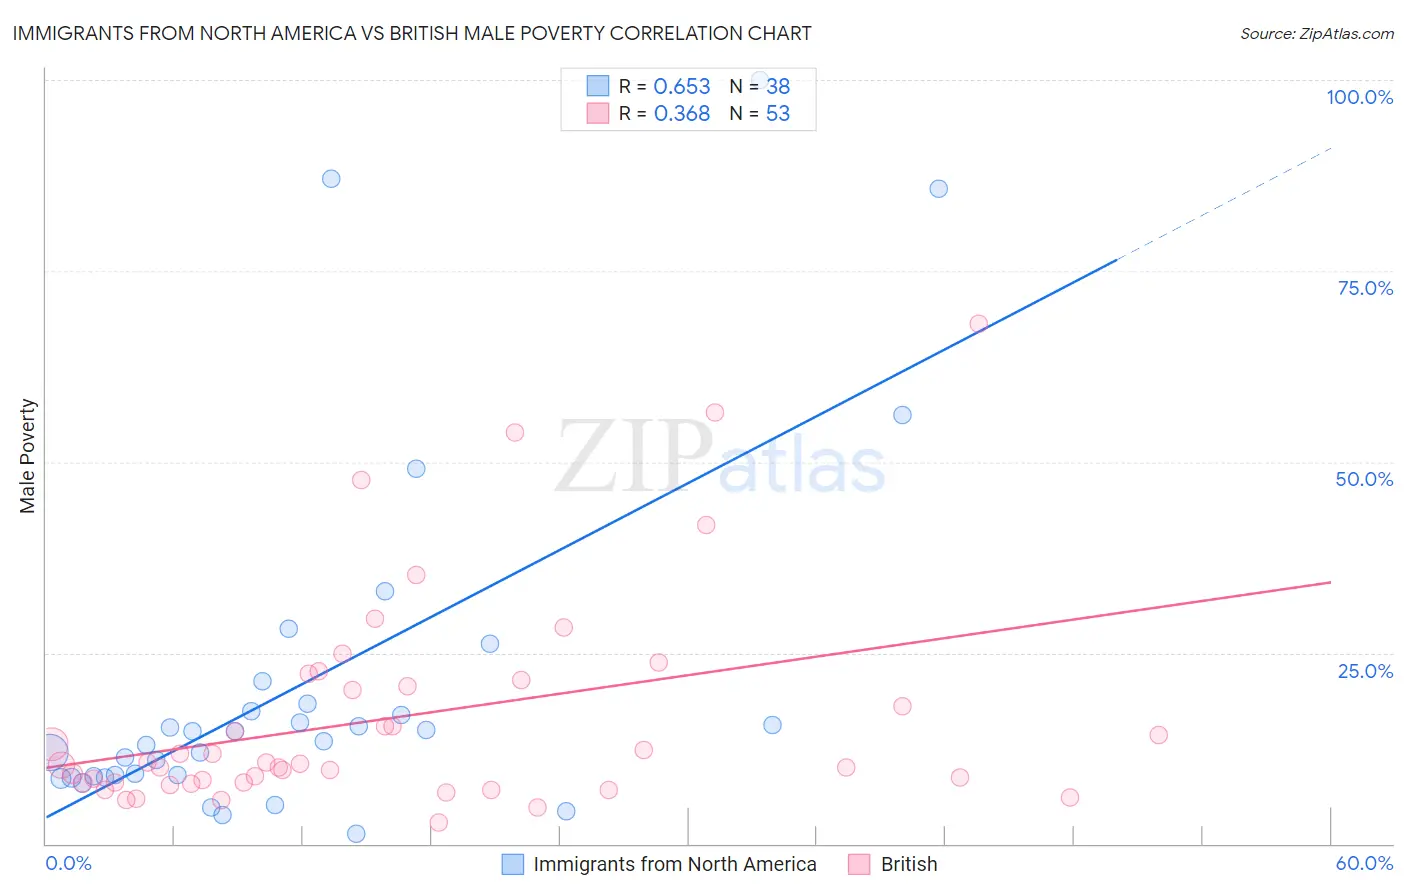
Immigrants from North America vs British Male Poverty Correlation Chart
The statistical analysis conducted on geographies consisting of 461,883,462 people shows a significant positive correlation between the proportion of Immigrants from North America and poverty level among males in the United States with a correlation coefficient (R) of 0.653 and weighted average of 10.3%. Similarly, the statistical analysis conducted on geographies consisting of 530,450,397 people shows a mild positive correlation between the proportion of British and poverty level among males in the United States with a correlation coefficient (R) of 0.368 and weighted average of 10.4%, a difference of 1.1%.
Male Poverty Correlation Summary
| Measurement | Immigrants from North America | British |
| Minimum | 1.3% | 2.8% |
| Maximum | 100.0% | 68.2% |
| Range | 98.8% | 65.4% |
| Mean | 21.2% | 16.5% |
| Median | 14.1% | 10.4% |
| Interquartile 25% (IQ1) | 8.9% | 8.0% |
| Interquartile 75% (IQ3) | 18.3% | 21.0% |
| Interquartile Range (IQR) | 9.5% | 13.0% |
| Standard Deviation (Sample) | 23.5% | 14.2% |
| Standard Deviation (Population) | 23.2% | 14.0% |
Demographics Similar to Immigrants from North America and British by Male Poverty
In terms of male poverty, the demographic groups most similar to Immigrants from North America are English (10.3%, a difference of 0.080%), Irish (10.3%, a difference of 0.24%), Immigrants from Belgium (10.3%, a difference of 0.26%), Dutch (10.2%, a difference of 0.29%), and Carpatho Rusyn (10.2%, a difference of 0.30%). Similarly, the demographic groups most similar to British are Indian (Asian) (10.4%, a difference of 0.070%), Immigrants from Denmark (10.4%, a difference of 0.090%), Cambodian (10.4%, a difference of 0.10%), Jordanian (10.4%, a difference of 0.20%), and Australian (10.4%, a difference of 0.20%).
| Demographics | Rating | Rank | Male Poverty |
| Carpatho Rusyns | 96.9 /100 | #75 | Exceptional 10.2% |
| Dutch | 96.9 /100 | #76 | Exceptional 10.2% |
| Immigrants | Belgium | 96.8 /100 | #77 | Exceptional 10.3% |
| Irish | 96.8 /100 | #78 | Exceptional 10.3% |
| Immigrants | North America | 96.5 /100 | #79 | Exceptional 10.3% |
| English | 96.4 /100 | #80 | Exceptional 10.3% |
| Belgians | 95.9 /100 | #81 | Exceptional 10.3% |
| Egyptians | 95.9 /100 | #82 | Exceptional 10.3% |
| Immigrants | Sweden | 95.7 /100 | #83 | Exceptional 10.3% |
| Czechoslovakians | 95.6 /100 | #84 | Exceptional 10.3% |
| Immigrants | England | 95.5 /100 | #85 | Exceptional 10.4% |
| Immigrants | Eastern Asia | 95.3 /100 | #86 | Exceptional 10.4% |
| Northern Europeans | 95.2 /100 | #87 | Exceptional 10.4% |
| Cambodians | 95.0 /100 | #88 | Exceptional 10.4% |
| Immigrants | Denmark | 95.0 /100 | #89 | Exceptional 10.4% |
| Indians (Asian) | 94.9 /100 | #90 | Exceptional 10.4% |
| British | 94.8 /100 | #91 | Exceptional 10.4% |
| Jordanians | 94.4 /100 | #92 | Exceptional 10.4% |
| Australians | 94.4 /100 | #93 | Exceptional 10.4% |
| Immigrants | South Africa | 94.1 /100 | #94 | Exceptional 10.4% |
| Scottish | 94.0 /100 | #95 | Exceptional 10.4% |