Uruguayan vs Immigrants from Western Asia Male Poverty
COMPARE
Uruguayan
Immigrants from Western Asia
Male Poverty
Male Poverty Comparison
Uruguayans
Immigrants from Western Asia
11.2%
MALE POVERTY
51.0/ 100
METRIC RATING
171st/ 347
METRIC RANK
11.8%
MALE POVERTY
9.8/ 100
METRIC RATING
203rd/ 347
METRIC RANK
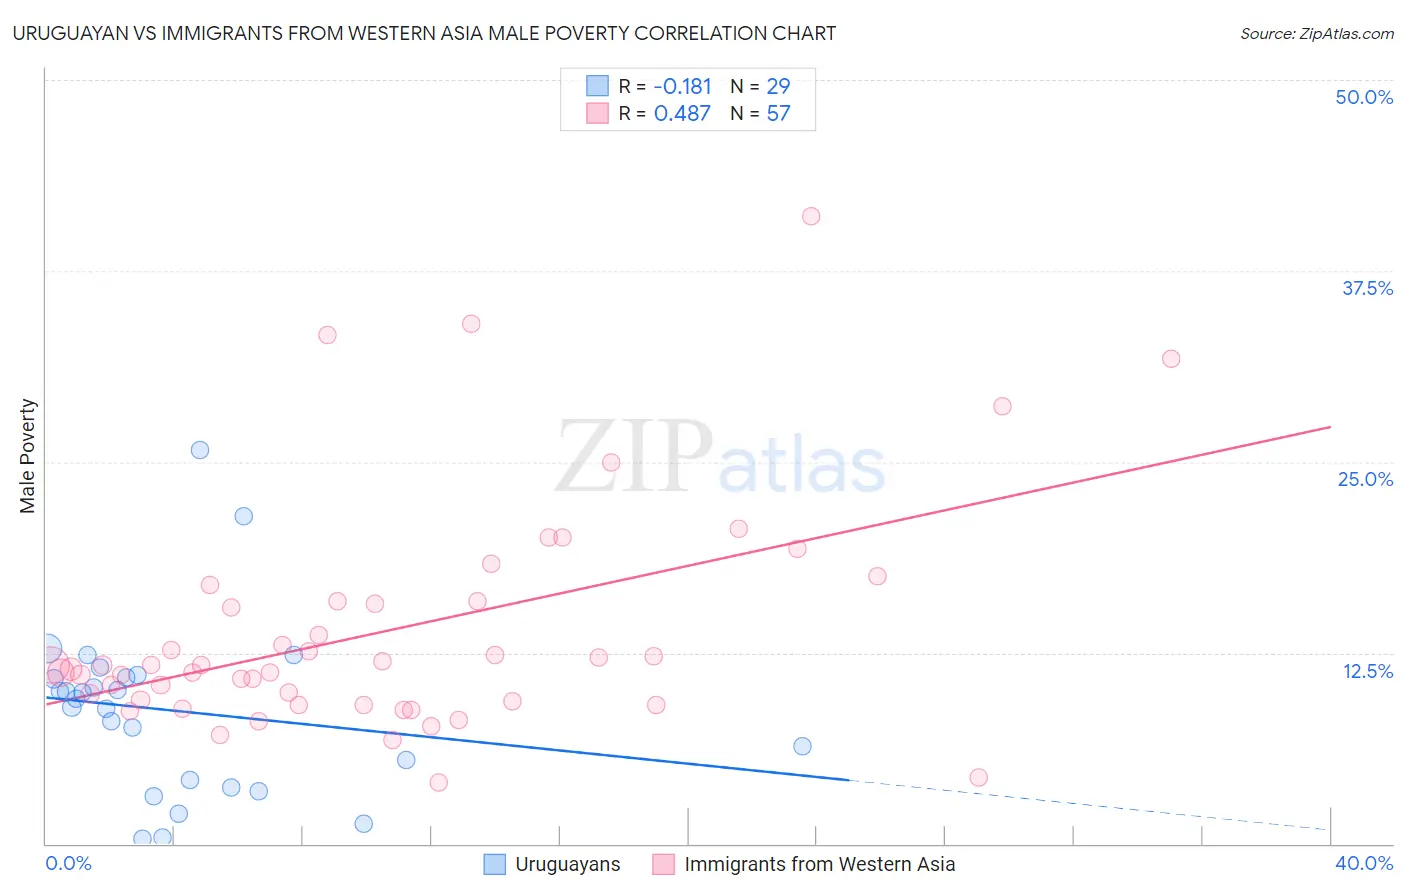
Uruguayan vs Immigrants from Western Asia Male Poverty Correlation Chart
The statistical analysis conducted on geographies consisting of 144,748,239 people shows a poor negative correlation between the proportion of Uruguayans and poverty level among males in the United States with a correlation coefficient (R) of -0.181 and weighted average of 11.2%. Similarly, the statistical analysis conducted on geographies consisting of 404,054,336 people shows a moderate positive correlation between the proportion of Immigrants from Western Asia and poverty level among males in the United States with a correlation coefficient (R) of 0.487 and weighted average of 11.8%, a difference of 5.5%.
Male Poverty Correlation Summary
| Measurement | Uruguayan | Immigrants from Western Asia |
| Minimum | 0.34% | 4.0% |
| Maximum | 25.8% | 41.1% |
| Range | 25.4% | 37.1% |
| Mean | 8.7% | 13.9% |
| Median | 9.5% | 11.7% |
| Interquartile 25% (IQ1) | 3.9% | 9.2% |
| Interquartile 75% (IQ3) | 11.0% | 15.9% |
| Interquartile Range (IQR) | 7.0% | 6.7% |
| Standard Deviation (Sample) | 5.6% | 7.5% |
| Standard Deviation (Population) | 5.5% | 7.4% |
Similar Demographics by Male Poverty
Demographics Similar to Uruguayans by Male Poverty
In terms of male poverty, the demographic groups most similar to Uruguayans are Immigrants from Ethiopia (11.2%, a difference of 0.040%), Pennsylvania German (11.2%, a difference of 0.060%), Immigrants from Oceania (11.2%, a difference of 0.10%), South American (11.1%, a difference of 0.27%), and Immigrants from Colombia (11.1%, a difference of 0.31%).
| Demographics | Rating | Rank | Male Poverty |
| Ethiopians | 56.7 /100 | #164 | Average 11.1% |
| Immigrants | Spain | 55.5 /100 | #165 | Average 11.1% |
| Immigrants | Albania | 55.3 /100 | #166 | Average 11.1% |
| Hungarians | 55.1 /100 | #167 | Average 11.1% |
| Immigrants | Portugal | 54.9 /100 | #168 | Average 11.1% |
| Immigrants | Colombia | 54.2 /100 | #169 | Average 11.1% |
| South Americans | 53.8 /100 | #170 | Average 11.1% |
| Uruguayans | 51.0 /100 | #171 | Average 11.2% |
| Immigrants | Ethiopia | 50.7 /100 | #172 | Average 11.2% |
| Pennsylvania Germans | 50.5 /100 | #173 | Average 11.2% |
| Immigrants | Oceania | 50.0 /100 | #174 | Average 11.2% |
| Celtics | 47.5 /100 | #175 | Average 11.2% |
| Immigrants | Fiji | 46.0 /100 | #176 | Average 11.2% |
| Lebanese | 45.6 /100 | #177 | Average 11.2% |
| Immigrants | Cameroon | 44.5 /100 | #178 | Average 11.2% |
Demographics Similar to Immigrants from Western Asia by Male Poverty
In terms of male poverty, the demographic groups most similar to Immigrants from Western Asia are Aleut (11.8%, a difference of 0.14%), Immigrants from Uganda (11.8%, a difference of 0.36%), Spaniard (11.7%, a difference of 0.86%), Immigrants from Lebanon (11.7%, a difference of 0.87%), and Spanish (11.7%, a difference of 0.97%).
| Demographics | Rating | Rank | Male Poverty |
| Hmong | 15.8 /100 | #196 | Poor 11.6% |
| Delaware | 15.4 /100 | #197 | Poor 11.7% |
| Iraqis | 14.7 /100 | #198 | Poor 11.7% |
| Spanish | 14.1 /100 | #199 | Poor 11.7% |
| Immigrants | Lebanon | 13.6 /100 | #200 | Poor 11.7% |
| Spaniards | 13.5 /100 | #201 | Poor 11.7% |
| Aleuts | 10.4 /100 | #202 | Poor 11.8% |
| Immigrants | Western Asia | 9.8 /100 | #203 | Tragic 11.8% |
| Immigrants | Uganda | 8.5 /100 | #204 | Tragic 11.8% |
| Panamanians | 6.2 /100 | #205 | Tragic 11.9% |
| Immigrants | Eastern Africa | 5.4 /100 | #206 | Tragic 12.0% |
| Malaysians | 5.2 /100 | #207 | Tragic 12.0% |
| Immigrants | Immigrants | 4.5 /100 | #208 | Tragic 12.0% |
| Immigrants | Azores | 4.3 /100 | #209 | Tragic 12.0% |
| Moroccans | 4.2 /100 | #210 | Tragic 12.0% |