Ukrainian vs Brazilian Receiving Food Stamps
COMPARE
Ukrainian
Brazilian
Receiving Food Stamps
Receiving Food Stamps Comparison
Ukrainians
Brazilians
10.7%
RECEIVING FOOD STAMPS
92.8/ 100
METRIC RATING
125th/ 347
METRIC RANK
11.1%
RECEIVING FOOD STAMPS
83.2/ 100
METRIC RATING
149th/ 347
METRIC RANK
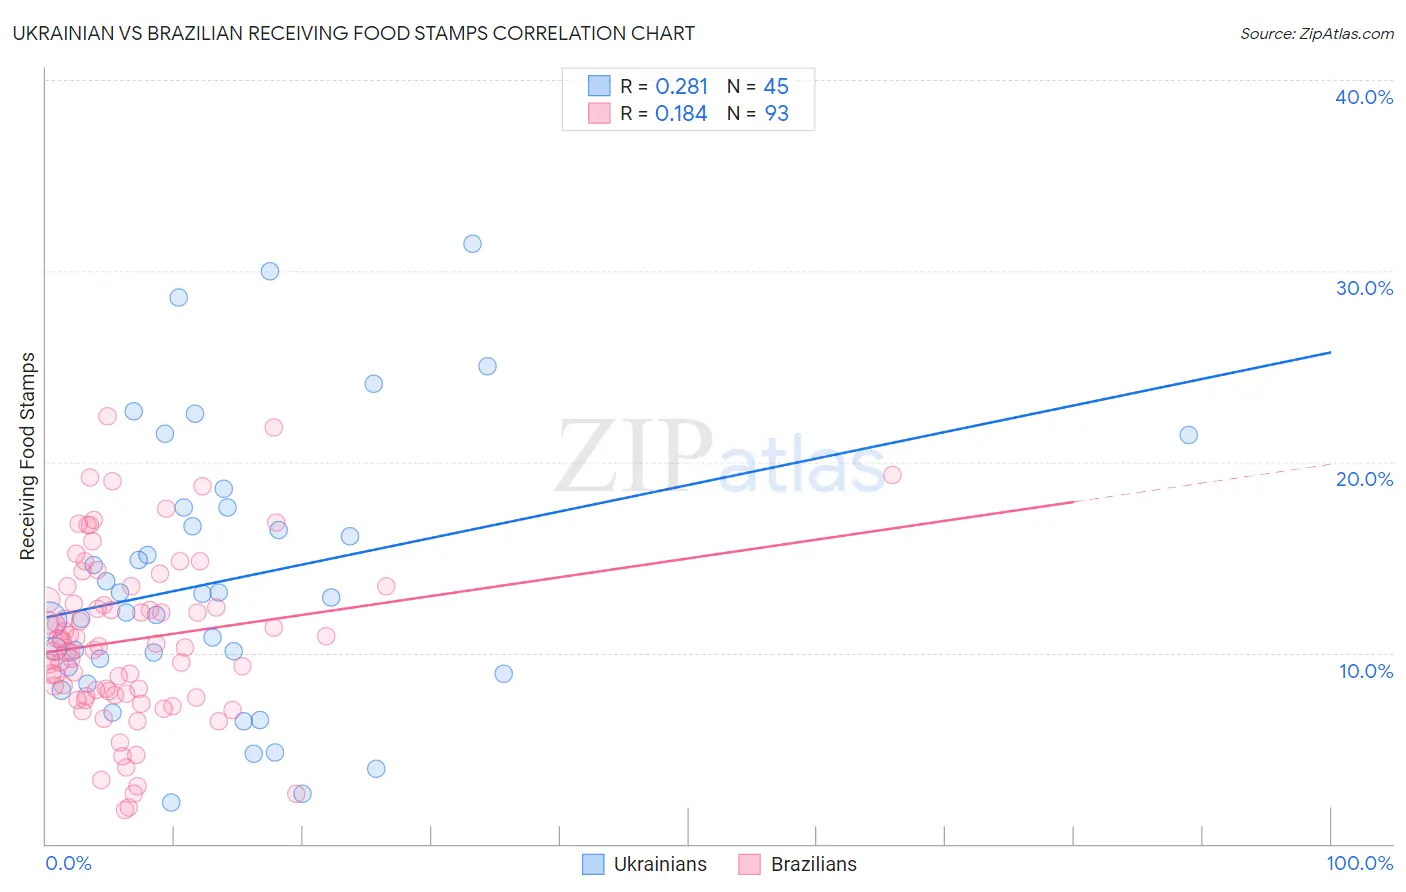
Ukrainian vs Brazilian Receiving Food Stamps Correlation Chart
The statistical analysis conducted on geographies consisting of 446,698,420 people shows a weak positive correlation between the proportion of Ukrainians and percentage of population receiving government assistance and/or food stamps in the United States with a correlation coefficient (R) of 0.281 and weighted average of 10.7%. Similarly, the statistical analysis conducted on geographies consisting of 322,932,120 people shows a poor positive correlation between the proportion of Brazilians and percentage of population receiving government assistance and/or food stamps in the United States with a correlation coefficient (R) of 0.184 and weighted average of 11.1%, a difference of 3.7%.
Receiving Food Stamps Correlation Summary
| Measurement | Ukrainian | Brazilian |
| Minimum | 2.2% | 1.8% |
| Maximum | 31.4% | 22.4% |
| Range | 29.2% | 20.6% |
| Mean | 13.8% | 10.7% |
| Median | 12.9% | 10.3% |
| Interquartile 25% (IQ1) | 9.1% | 7.8% |
| Interquartile 75% (IQ3) | 17.6% | 13.1% |
| Interquartile Range (IQR) | 8.5% | 5.3% |
| Standard Deviation (Sample) | 7.2% | 4.4% |
| Standard Deviation (Population) | 7.1% | 4.3% |
Similar Demographics by Receiving Food Stamps
Demographics Similar to Ukrainians by Receiving Food Stamps
In terms of receiving food stamps, the demographic groups most similar to Ukrainians are Paraguayan (10.7%, a difference of 0.080%), Afghan (10.7%, a difference of 0.14%), Immigrants from Ethiopia (10.7%, a difference of 0.16%), Immigrants from Jordan (10.7%, a difference of 0.17%), and Yugoslavian (10.7%, a difference of 0.17%).
| Demographics | Rating | Rank | Receiving Food Stamps |
| Assyrians/Chaldeans/Syriacs | 94.1 /100 | #118 | Exceptional 10.6% |
| Immigrants | Poland | 93.9 /100 | #119 | Exceptional 10.6% |
| Ethiopians | 93.9 /100 | #120 | Exceptional 10.6% |
| Slavs | 93.8 /100 | #121 | Exceptional 10.6% |
| Sri Lankans | 93.7 /100 | #122 | Exceptional 10.6% |
| Immigrants | Philippines | 93.3 /100 | #123 | Exceptional 10.7% |
| Paraguayans | 93.0 /100 | #124 | Exceptional 10.7% |
| Ukrainians | 92.8 /100 | #125 | Exceptional 10.7% |
| Afghans | 92.6 /100 | #126 | Exceptional 10.7% |
| Immigrants | Ethiopia | 92.6 /100 | #127 | Exceptional 10.7% |
| Immigrants | Jordan | 92.5 /100 | #128 | Exceptional 10.7% |
| Yugoslavians | 92.5 /100 | #129 | Exceptional 10.7% |
| Israelis | 92.4 /100 | #130 | Exceptional 10.7% |
| French | 92.3 /100 | #131 | Exceptional 10.7% |
| Immigrants | Germany | 92.0 /100 | #132 | Exceptional 10.7% |
Demographics Similar to Brazilians by Receiving Food Stamps
In terms of receiving food stamps, the demographic groups most similar to Brazilians are Immigrants from South Eastern Asia (11.1%, a difference of 0.020%), Soviet Union (11.1%, a difference of 0.020%), White/Caucasian (11.1%, a difference of 0.18%), Taiwanese (11.0%, a difference of 0.28%), and Immigrants from Spain (11.1%, a difference of 0.38%).
| Demographics | Rating | Rank | Receiving Food Stamps |
| Chileans | 86.2 /100 | #142 | Excellent 11.0% |
| Immigrants | Northern Africa | 86.0 /100 | #143 | Excellent 11.0% |
| Syrians | 85.5 /100 | #144 | Excellent 11.0% |
| Hungarians | 85.1 /100 | #145 | Excellent 11.0% |
| Taiwanese | 84.2 /100 | #146 | Excellent 11.0% |
| Whites/Caucasians | 83.9 /100 | #147 | Excellent 11.1% |
| Immigrants | South Eastern Asia | 83.3 /100 | #148 | Excellent 11.1% |
| Brazilians | 83.2 /100 | #149 | Excellent 11.1% |
| Soviet Union | 83.1 /100 | #150 | Excellent 11.1% |
| Immigrants | Spain | 81.7 /100 | #151 | Excellent 11.1% |
| Immigrants | Kazakhstan | 81.7 /100 | #152 | Excellent 11.1% |
| Lebanese | 81.6 /100 | #153 | Excellent 11.1% |
| Armenians | 81.4 /100 | #154 | Excellent 11.1% |
| Immigrants | Argentina | 80.4 /100 | #155 | Excellent 11.2% |
| Immigrants | Afghanistan | 75.6 /100 | #156 | Good 11.3% |