Ukrainian vs Immigrants from West Indies Receiving Food Stamps
COMPARE
Ukrainian
Immigrants from West Indies
Receiving Food Stamps
Receiving Food Stamps Comparison
Ukrainians
Immigrants from West Indies
10.7%
RECEIVING FOOD STAMPS
92.8/ 100
METRIC RATING
125th/ 347
METRIC RANK
16.1%
RECEIVING FOOD STAMPS
0.0/ 100
METRIC RATING
302nd/ 347
METRIC RANK
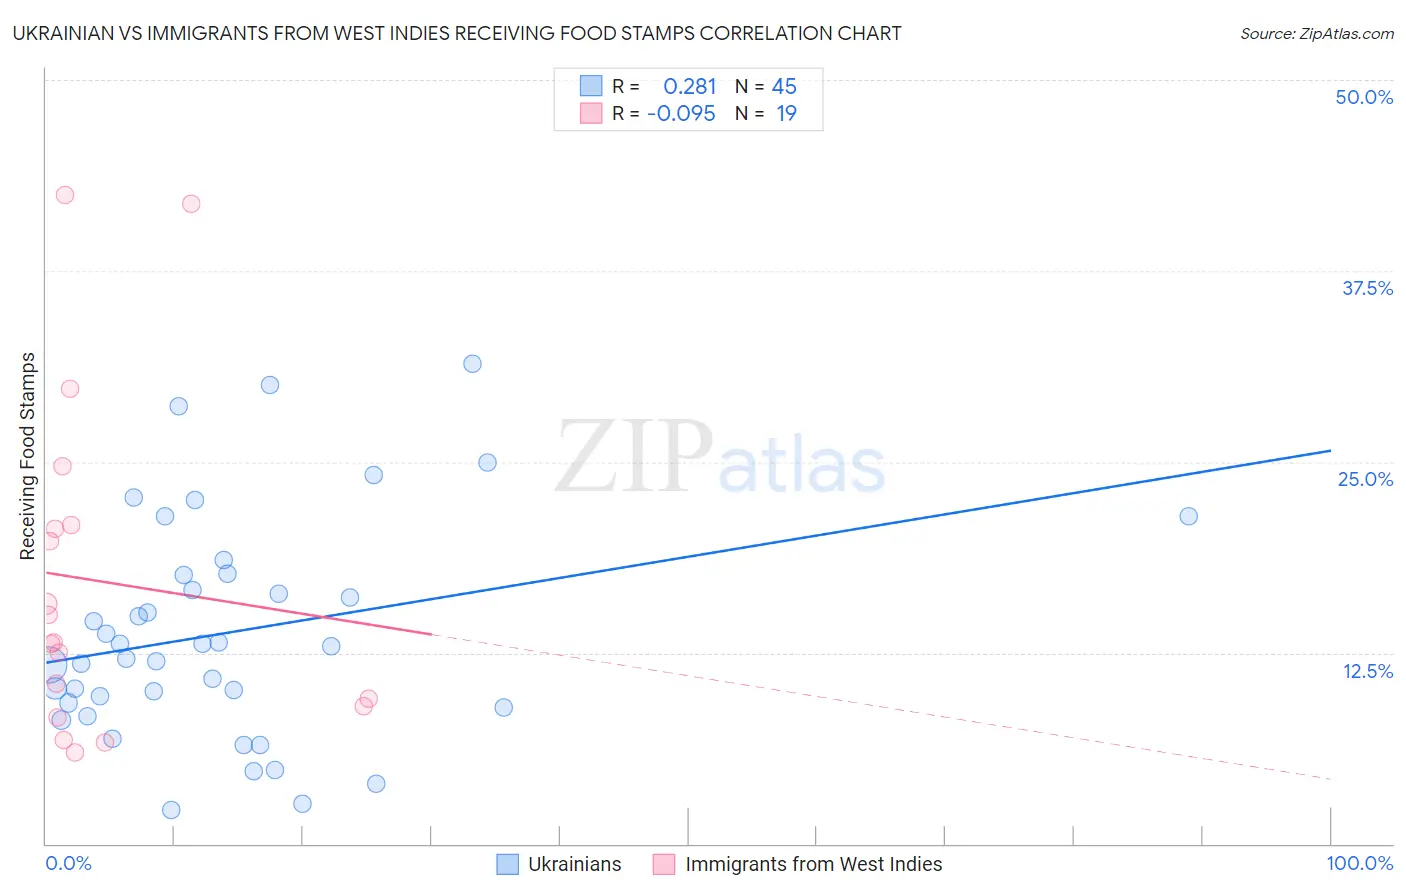
Ukrainian vs Immigrants from West Indies Receiving Food Stamps Correlation Chart
The statistical analysis conducted on geographies consisting of 446,698,420 people shows a weak positive correlation between the proportion of Ukrainians and percentage of population receiving government assistance and/or food stamps in the United States with a correlation coefficient (R) of 0.281 and weighted average of 10.7%. Similarly, the statistical analysis conducted on geographies consisting of 72,442,413 people shows a slight negative correlation between the proportion of Immigrants from West Indies and percentage of population receiving government assistance and/or food stamps in the United States with a correlation coefficient (R) of -0.095 and weighted average of 16.1%, a difference of 50.9%.
Receiving Food Stamps Correlation Summary
| Measurement | Ukrainian | Immigrants from West Indies |
| Minimum | 2.2% | 6.0% |
| Maximum | 31.4% | 42.5% |
| Range | 29.2% | 36.5% |
| Mean | 13.8% | 17.2% |
| Median | 12.9% | 13.1% |
| Interquartile 25% (IQ1) | 9.1% | 9.0% |
| Interquartile 75% (IQ3) | 17.6% | 20.9% |
| Interquartile Range (IQR) | 8.5% | 11.9% |
| Standard Deviation (Sample) | 7.2% | 10.9% |
| Standard Deviation (Population) | 7.1% | 10.7% |
Similar Demographics by Receiving Food Stamps
Demographics Similar to Ukrainians by Receiving Food Stamps
In terms of receiving food stamps, the demographic groups most similar to Ukrainians are Paraguayan (10.7%, a difference of 0.080%), Afghan (10.7%, a difference of 0.14%), Immigrants from Ethiopia (10.7%, a difference of 0.16%), Immigrants from Jordan (10.7%, a difference of 0.17%), and Yugoslavian (10.7%, a difference of 0.17%).
| Demographics | Rating | Rank | Receiving Food Stamps |
| Assyrians/Chaldeans/Syriacs | 94.1 /100 | #118 | Exceptional 10.6% |
| Immigrants | Poland | 93.9 /100 | #119 | Exceptional 10.6% |
| Ethiopians | 93.9 /100 | #120 | Exceptional 10.6% |
| Slavs | 93.8 /100 | #121 | Exceptional 10.6% |
| Sri Lankans | 93.7 /100 | #122 | Exceptional 10.6% |
| Immigrants | Philippines | 93.3 /100 | #123 | Exceptional 10.7% |
| Paraguayans | 93.0 /100 | #124 | Exceptional 10.7% |
| Ukrainians | 92.8 /100 | #125 | Exceptional 10.7% |
| Afghans | 92.6 /100 | #126 | Exceptional 10.7% |
| Immigrants | Ethiopia | 92.6 /100 | #127 | Exceptional 10.7% |
| Immigrants | Jordan | 92.5 /100 | #128 | Exceptional 10.7% |
| Yugoslavians | 92.5 /100 | #129 | Exceptional 10.7% |
| Israelis | 92.4 /100 | #130 | Exceptional 10.7% |
| French | 92.3 /100 | #131 | Exceptional 10.7% |
| Immigrants | Germany | 92.0 /100 | #132 | Exceptional 10.7% |
Demographics Similar to Immigrants from West Indies by Receiving Food Stamps
In terms of receiving food stamps, the demographic groups most similar to Immigrants from West Indies are Nicaraguan (16.1%, a difference of 0.090%), West Indian (16.3%, a difference of 0.77%), Trinidadian and Tobagonian (16.0%, a difference of 0.94%), Immigrants from Bangladesh (15.9%, a difference of 1.4%), and Immigrants from the Azores (16.4%, a difference of 1.7%).
| Demographics | Rating | Rank | Receiving Food Stamps |
| Immigrants | Honduras | 0.0 /100 | #295 | Tragic 15.7% |
| Tsimshian | 0.0 /100 | #296 | Tragic 15.7% |
| Immigrants | Bahamas | 0.0 /100 | #297 | Tragic 15.8% |
| Immigrants | Trinidad and Tobago | 0.0 /100 | #298 | Tragic 15.8% |
| Hispanics or Latinos | 0.0 /100 | #299 | Tragic 15.8% |
| Immigrants | Bangladesh | 0.0 /100 | #300 | Tragic 15.9% |
| Trinidadians and Tobagonians | 0.0 /100 | #301 | Tragic 16.0% |
| Immigrants | West Indies | 0.0 /100 | #302 | Tragic 16.1% |
| Nicaraguans | 0.0 /100 | #303 | Tragic 16.1% |
| West Indians | 0.0 /100 | #304 | Tragic 16.3% |
| Immigrants | Azores | 0.0 /100 | #305 | Tragic 16.4% |
| Jamaicans | 0.0 /100 | #306 | Tragic 16.4% |
| Houma | 0.0 /100 | #307 | Tragic 16.5% |
| Barbadians | 0.0 /100 | #308 | Tragic 16.5% |
| U.S. Virgin Islanders | 0.0 /100 | #309 | Tragic 16.5% |