Ukrainian vs Pennsylvania German Receiving Food Stamps

COMPARE

Ukrainian
Race
Ancestry
AfghanAfricanAlaska NativeAlaskan AthabascanAlbanianAleutAlsatianAmericanApacheArabArapahoArgentineanArmenianAssyrian/Chaldean/SyriacAustralianAustrianBahamianBangladeshiBarbadianBasqueBelgianBelizeanBermudanBhutaneseBlackfeetBolivianBrazilianBritishBritish West IndianBulgarianBurmeseCajunCambodianCanadianCape VerdeanCarpatho RusynCelticCentral AmericanCentral American IndianCherokeeCheyenneChickasawChileanChineseChippewaChoctawColombianColvilleComancheCosta RicanCreeCreekCroatianCrowCubanCypriotCzechCzechoslovakianDanishDelawareDominicanDutchDutch West IndianEastern EuropeanEcuadorianEgyptianEnglishEstonianEthiopianEuropeanFijianFilipinoFinnishFrenchFrench American IndianFrench CanadianGermanGerman RussianGhanaianGreekGuamanian/ChamorroGuatemalanGuyaneseHaitianHmongHonduranHopiHoumaHungarianIcelanderIndian (Asian)IndonesianInupiatIranianIraqiIrishIroquoisIsraeliItalianJamaicanJapaneseJordanianKenyanKiowaKoreanLaotianLatvianLebaneseLiberianLithuanianLumbeeLuxembourgerMacedonianMalaysianMalteseMarshalleseMenomineeMexicanMexican American IndianMongolianMoroccanNative HawaiianNavajoNepaleseNew ZealanderNicaraguanNigerianNorthern EuropeanNorwegianOkinawanOsageOttawaPaiutePakistaniPalestinianPanamanianParaguayanPeruvianPimaPolishPortuguesePotawatomiPuebloPuerto RicanPuget Sound SalishRomanianRussianSalvadoranSamoanScandinavianScotch-IrishScottishSeminoleSenegaleseSerbianShoshoneSierra LeoneanSiouxSlavicSlovakSloveneSomaliSouth AfricanSouth AmericanSouth American IndianSoviet UnionSpaniardSpanishSpanish AmericanSpanish American IndianSri LankanSubsaharan AfricanSudaneseSwedishSwissSyrianTaiwaneseThaiTlingit-HaidaTohono O'OdhamTonganTrinidadian and TobagonianTsimshianTurkishU.S. Virgin IslanderUgandanUkrainianUruguayanUteVenezuelanVietnameseWelshWest IndianYakamaYaquiYugoslavianYumanYup'ikZimbabwean
Immigration
NonimmigrantsImmigrantsAfghanistanAfricaAlbaniaArgentinaArmeniaAsiaAustraliaAustriaBahamasBangladeshBarbadosBelarusBelgiumBelizeBoliviaBosnia and HerzegovinaBrazilBulgariaBurma/MyanmarCabo VerdeCambodiaCameroonCanadaCaribbeanCentral AmericaChileChinaColombiaCongoCosta RicaCroatiaCubaCzechoslovakiaDenmarkDominicaDominican RepublicEastern AfricaEastern AsiaEastern EuropeEcuadorEgyptEl SalvadorEnglandEritreaEthiopiaEuropeFijiFranceGermanyGhanaGreeceGrenadaGuatemalaGuyanaHaitiHondurasHong KongHungaryIndiaIndonesiaIranIraqIrelandIsraelItalyJamaicaJapanJordanKazakhstanKenyaKoreaKuwaitLaosLatin AmericaLatviaLebanonLiberiaLithuaniaMalaysiaMexicoMicronesiaMiddle AfricaMoldovaMoroccoNepalNetherlandsNicaraguaNigeriaNorth AmericaNorth MacedoniaNorthern AfricaNorthern EuropeNorwayOceaniaPakistanPanamaPeruPhilippinesPolandPortugalRomaniaRussiaSaudi ArabiaScotlandSenegalSerbiaSierra LeoneSingaporeSomaliaSouth AfricaSouth AmericaSouth Central AsiaSouth Eastern AsiaSouthern EuropeSpainSri LankaSt. Vincent and the GrenadinesSudanSwedenSwitzerlandSyriaTaiwanThailandTrinidad and TobagoTurkeyUgandaUkraineUruguayUzbekistanVenezuelaVietnamWest IndiesWestern AfricaWestern AsiaWestern EuropeYemenZaireZimbabweAzores
Pennsylvania German
Race
Ancestry
AfghanAfricanAlaska NativeAlaskan AthabascanAlbanianAleutAlsatianAmericanApacheArabArapahoArgentineanArmenianAssyrian/Chaldean/SyriacAustralianAustrianBahamianBangladeshiBarbadianBasqueBelgianBelizeanBermudanBhutaneseBlackfeetBolivianBrazilianBritishBritish West IndianBulgarianBurmeseCajunCambodianCanadianCape VerdeanCarpatho RusynCelticCentral AmericanCentral American IndianCherokeeCheyenneChickasawChileanChineseChippewaChoctawColombianColvilleComancheCosta RicanCreeCreekCroatianCrowCubanCypriotCzechCzechoslovakianDanishDelawareDominicanDutchDutch West IndianEastern EuropeanEcuadorianEgyptianEnglishEstonianEthiopianEuropeanFijianFilipinoFinnishFrenchFrench American IndianFrench CanadianGermanGerman RussianGhanaianGreekGuamanian/ChamorroGuatemalanGuyaneseHaitianHmongHonduranHopiHoumaHungarianIcelanderIndian (Asian)IndonesianInupiatIranianIraqiIrishIroquoisIsraeliItalianJamaicanJapaneseJordanianKenyanKiowaKoreanLaotianLatvianLebaneseLiberianLithuanianLumbeeLuxembourgerMacedonianMalaysianMalteseMarshalleseMenomineeMexicanMexican American IndianMongolianMoroccanNative HawaiianNavajoNepaleseNew ZealanderNicaraguanNigerianNorthern EuropeanNorwegianOkinawanOsageOttawaPaiutePakistaniPalestinianPanamanianParaguayanPennsylvania GermanPeruvianPimaPolishPortuguesePotawatomiPuebloPuerto RicanPuget Sound SalishRomanianRussianSalvadoranSamoanScandinavianScotch-IrishScottishSeminoleSenegaleseSerbianShoshoneSierra LeoneanSiouxSlavicSlovakSloveneSomaliSouth AfricanSouth AmericanSouth American IndianSoviet UnionSpaniardSpanishSpanish AmericanSpanish American IndianSri LankanSubsaharan AfricanSudaneseSwedishSwissSyrianTaiwaneseThaiTlingit-HaidaTohono O'OdhamTonganTrinidadian and TobagonianTsimshianTurkishU.S. Virgin IslanderUgandanUruguayanUteVenezuelanVietnameseWelshWest IndianYakamaYaquiYugoslavianYumanYup'ikZimbabwean
Immigration
NonimmigrantsImmigrantsAfghanistanAfricaAlbaniaArgentinaArmeniaAsiaAustraliaAustriaBahamasBangladeshBarbadosBelarusBelgiumBelizeBoliviaBosnia and HerzegovinaBrazilBulgariaBurma/MyanmarCabo VerdeCambodiaCameroonCanadaCaribbeanCentral AmericaChileChinaColombiaCongoCosta RicaCroatiaCubaCzechoslovakiaDenmarkDominicaDominican RepublicEastern AfricaEastern AsiaEastern EuropeEcuadorEgyptEl SalvadorEnglandEritreaEthiopiaEuropeFijiFranceGermanyGhanaGreeceGrenadaGuatemalaGuyanaHaitiHondurasHong KongHungaryIndiaIndonesiaIranIraqIrelandIsraelItalyJamaicaJapanJordanKazakhstanKenyaKoreaKuwaitLaosLatin AmericaLatviaLebanonLiberiaLithuaniaMalaysiaMexicoMicronesiaMiddle AfricaMoldovaMoroccoNepalNetherlandsNicaraguaNigeriaNorth AmericaNorth MacedoniaNorthern AfricaNorthern EuropeNorwayOceaniaPakistanPanamaPeruPhilippinesPolandPortugalRomaniaRussiaSaudi ArabiaScotlandSenegalSerbiaSierra LeoneSingaporeSomaliaSouth AfricaSouth AmericaSouth Central AsiaSouth Eastern AsiaSouthern EuropeSpainSri LankaSt. Vincent and the GrenadinesSudanSwedenSwitzerlandSyriaTaiwanThailandTrinidad and TobagoTurkeyUgandaUkraineUruguayUzbekistanVenezuelaVietnamWest IndiesWestern AfricaWestern AsiaWestern EuropeYemenZaireZimbabweAzores
Receiving Food Stamps
Income
Poverty
Unemployment
Labor Participation
Family Structure
Vehicle Availability
Education Level
Disability

Receiving Food Stamps Comparison

Ukrainians

Pennsylvania Germans

Exceptional
Good
10.7%
RECEIVING FOOD STAMPS
92.8/ 100
METRIC RATING
125th/ 347
METRIC RANK
11.4%
RECEIVING FOOD STAMPS
68.4/ 100
METRIC RATING
161st/ 347
METRIC RANK

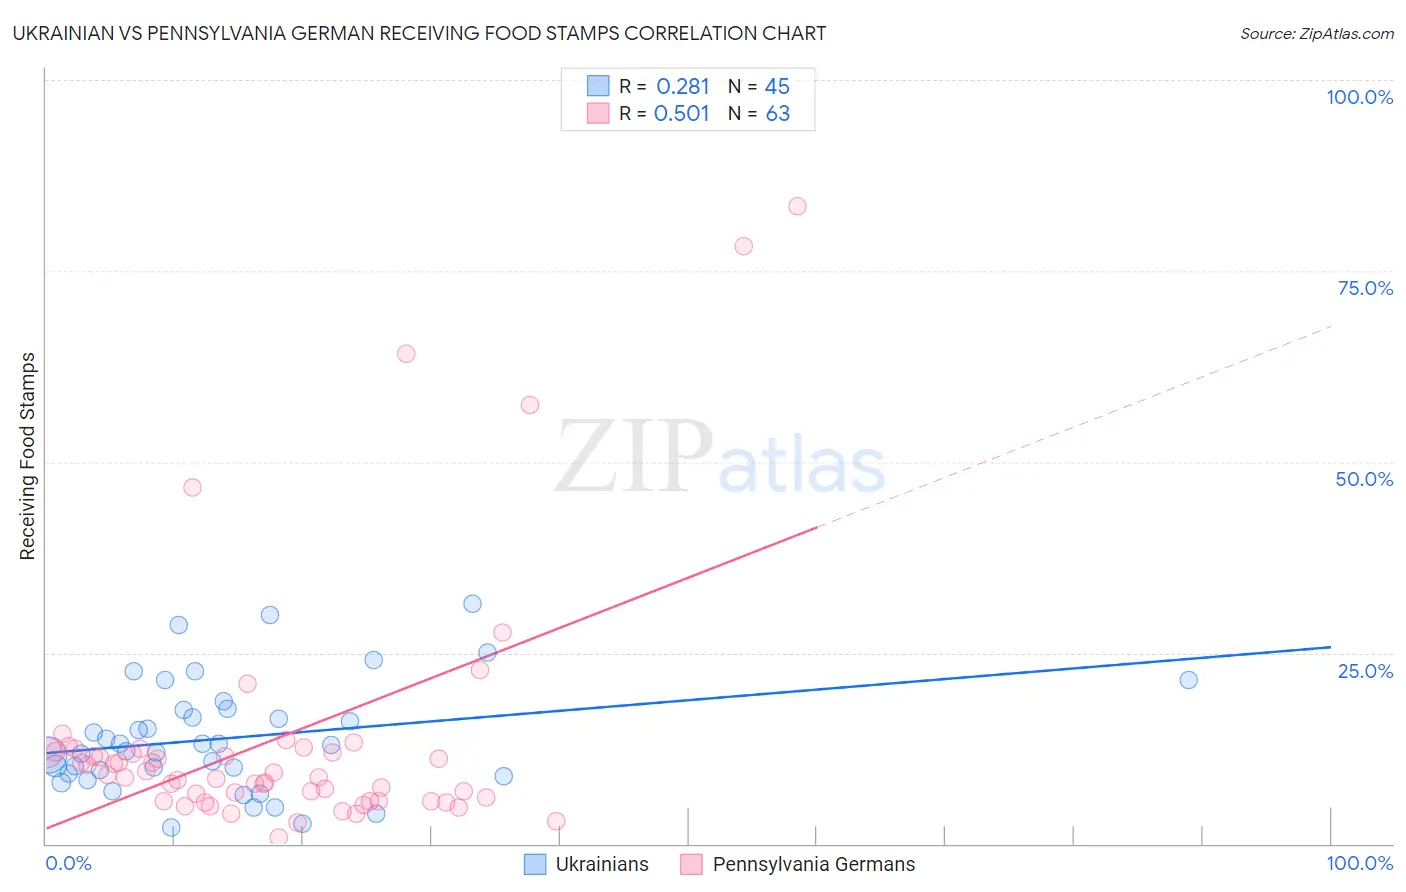
Ukrainian vs Pennsylvania German Receiving Food Stamps Correlation Chart

The statistical analysis conducted on geographies consisting of 446,698,420 people shows a weak positive correlation between the proportion of Ukrainians and percentage of population receiving government assistance and/or food stamps in the United States with a correlation coefficient (R) of 0.281 and weighted average of 10.7%. Similarly, the statistical analysis conducted on geographies consisting of 233,858,684 people shows a substantial positive correlation between the proportion of Pennsylvania Germans and percentage of population receiving government assistance and/or food stamps in the United States with a correlation coefficient (R) of 0.501 and weighted average of 11.4%, a difference of 6.9%.
Ukrainian vs Pennsylvania German Receiving Food Stamps

Receiving Food Stamps Correlation Summary

MeasurementUkrainianPennsylvania German
Minimum2.2%0.90%
Maximum31.4%83.5%
Range29.2%82.6%
Mean13.8%13.7%
Median12.9%8.9%
Interquartile 25% (IQ1)9.1%5.6%
Interquartile 75% (IQ3)17.6%12.0%
Interquartile Range (IQR)8.5%6.4%
Standard Deviation (Sample)7.2%16.6%
Standard Deviation (Population)7.1%16.4%

Similar Demographics by Receiving Food Stamps

Demographics Similar to Ukrainians by Receiving Food Stamps

In terms of receiving food stamps, the demographic groups most similar to Ukrainians are Paraguayan (10.7%, a difference of 0.080%), Afghan (10.7%, a difference of 0.14%), Immigrants from Ethiopia (10.7%, a difference of 0.16%), Immigrants from Jordan (10.7%, a difference of 0.17%), and Yugoslavian (10.7%, a difference of 0.17%).
DemographicsRating | RankReceiving Food Stamps
Assyrians/Chaldeans/Syriacs
94.1
/100
|
#118
Exceptional
10.6%
Immigrants | Poland
93.9
/100
|
#119
Exceptional
10.6%
Ethiopians
93.9
/100
|
#120
Exceptional
10.6%
Slavs
93.8
/100
|
#121
Exceptional
10.6%
Sri Lankans
93.7
/100
|
#122
Exceptional
10.6%
Immigrants | Philippines
93.3
/100
|
#123
Exceptional
10.7%
Paraguayans
93.0
/100
|
#124
Exceptional
10.7%
Ukrainians
92.8
/100
|
#125
Exceptional
10.7%
Afghans
92.6
/100
|
#126
Exceptional
10.7%
Immigrants | Ethiopia
92.6
/100
|
#127
Exceptional
10.7%
Immigrants | Jordan
92.5
/100
|
#128
Exceptional
10.7%
Yugoslavians
92.5
/100
|
#129
Exceptional
10.7%
Israelis
92.4
/100
|
#130
Exceptional
10.7%
French
92.3
/100
|
#131
Exceptional
10.7%
Immigrants | Germany
92.0
/100
|
#132
Exceptional
10.7%

Demographics Similar to Pennsylvania Germans by Receiving Food Stamps

In terms of receiving food stamps, the demographic groups most similar to Pennsylvania Germans are Alsatian (11.4%, a difference of 0.060%), French Canadian (11.4%, a difference of 0.18%), Immigrants from Oceania (11.4%, a difference of 0.34%), Immigrants from Southern Europe (11.5%, a difference of 0.43%), and Immigrants from Chile (11.5%, a difference of 0.55%).
DemographicsRating | RankReceiving Food Stamps
Armenians
81.4
/100
|
#154
Excellent
11.1%
Immigrants | Argentina
80.4
/100
|
#155
Excellent
11.2%
Immigrants | Afghanistan
75.6
/100
|
#156
Good
11.3%
Immigrants | Lebanon
75.2
/100
|
#157
Good
11.3%
Immigrants | Bosnia and Herzegovina
72.6
/100
|
#158
Good
11.3%
Immigrants | Oceania
70.4
/100
|
#159
Good
11.4%
French Canadians
69.5
/100
|
#160
Good
11.4%
Pennsylvania Germans
68.4
/100
|
#161
Good
11.4%
Alsatians
68.0
/100
|
#162
Good
11.4%
Immigrants | Southern Europe
65.8
/100
|
#163
Good
11.5%
Immigrants | Chile
65.0
/100
|
#164
Good
11.5%
Arabs
64.7
/100
|
#165
Good
11.5%
Immigrants | Belarus
62.8
/100
|
#166
Good
11.5%
Kenyans
60.2
/100
|
#167
Good
11.6%
Tlingit-Haida
59.1
/100
|
#168
Average
11.6%