West Indian vs Brazilian Receiving Food Stamps
COMPARE
West Indian
Brazilian
Receiving Food Stamps
Receiving Food Stamps Comparison
West Indians
Brazilians
16.3%
RECEIVING FOOD STAMPS
0.0/ 100
METRIC RATING
304th/ 347
METRIC RANK
11.1%
RECEIVING FOOD STAMPS
83.2/ 100
METRIC RATING
149th/ 347
METRIC RANK
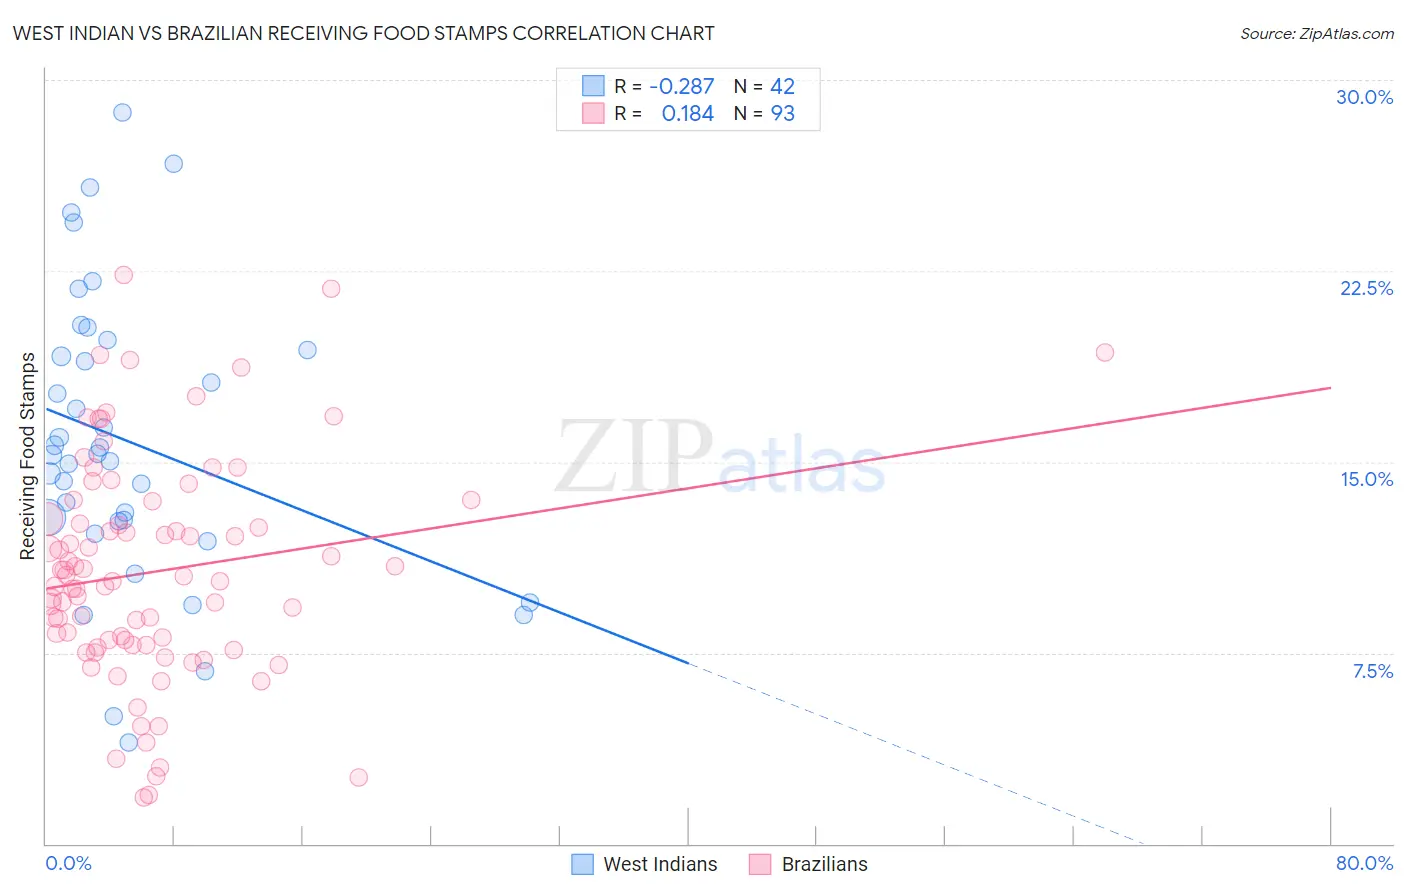
West Indian vs Brazilian Receiving Food Stamps Correlation Chart
The statistical analysis conducted on geographies consisting of 253,628,071 people shows a weak negative correlation between the proportion of West Indians and percentage of population receiving government assistance and/or food stamps in the United States with a correlation coefficient (R) of -0.287 and weighted average of 16.3%. Similarly, the statistical analysis conducted on geographies consisting of 322,932,120 people shows a poor positive correlation between the proportion of Brazilians and percentage of population receiving government assistance and/or food stamps in the United States with a correlation coefficient (R) of 0.184 and weighted average of 11.1%, a difference of 46.7%.
Receiving Food Stamps Correlation Summary
| Measurement | West Indian | Brazilian |
| Minimum | 4.0% | 1.8% |
| Maximum | 28.7% | 22.4% |
| Range | 24.7% | 20.6% |
| Mean | 15.8% | 10.7% |
| Median | 15.3% | 10.3% |
| Interquartile 25% (IQ1) | 12.7% | 7.8% |
| Interquartile 75% (IQ3) | 19.4% | 13.1% |
| Interquartile Range (IQR) | 6.7% | 5.3% |
| Standard Deviation (Sample) | 5.7% | 4.4% |
| Standard Deviation (Population) | 5.6% | 4.3% |
Similar Demographics by Receiving Food Stamps
Demographics Similar to West Indians by Receiving Food Stamps
In terms of receiving food stamps, the demographic groups most similar to West Indians are Nicaraguan (16.1%, a difference of 0.68%), Immigrants from West Indies (16.1%, a difference of 0.77%), Immigrants from the Azores (16.4%, a difference of 0.88%), Jamaican (16.4%, a difference of 0.94%), and Houma (16.5%, a difference of 1.2%).
| Demographics | Rating | Rank | Receiving Food Stamps |
| Immigrants | Bahamas | 0.0 /100 | #297 | Tragic 15.8% |
| Immigrants | Trinidad and Tobago | 0.0 /100 | #298 | Tragic 15.8% |
| Hispanics or Latinos | 0.0 /100 | #299 | Tragic 15.8% |
| Immigrants | Bangladesh | 0.0 /100 | #300 | Tragic 15.9% |
| Trinidadians and Tobagonians | 0.0 /100 | #301 | Tragic 16.0% |
| Immigrants | West Indies | 0.0 /100 | #302 | Tragic 16.1% |
| Nicaraguans | 0.0 /100 | #303 | Tragic 16.1% |
| West Indians | 0.0 /100 | #304 | Tragic 16.3% |
| Immigrants | Azores | 0.0 /100 | #305 | Tragic 16.4% |
| Jamaicans | 0.0 /100 | #306 | Tragic 16.4% |
| Houma | 0.0 /100 | #307 | Tragic 16.5% |
| Barbadians | 0.0 /100 | #308 | Tragic 16.5% |
| U.S. Virgin Islanders | 0.0 /100 | #309 | Tragic 16.5% |
| Immigrants | Barbados | 0.0 /100 | #310 | Tragic 16.6% |
| Guyanese | 0.0 /100 | #311 | Tragic 16.7% |
Demographics Similar to Brazilians by Receiving Food Stamps
In terms of receiving food stamps, the demographic groups most similar to Brazilians are Immigrants from South Eastern Asia (11.1%, a difference of 0.020%), Soviet Union (11.1%, a difference of 0.020%), White/Caucasian (11.1%, a difference of 0.18%), Taiwanese (11.0%, a difference of 0.28%), and Immigrants from Spain (11.1%, a difference of 0.38%).
| Demographics | Rating | Rank | Receiving Food Stamps |
| Chileans | 86.2 /100 | #142 | Excellent 11.0% |
| Immigrants | Northern Africa | 86.0 /100 | #143 | Excellent 11.0% |
| Syrians | 85.5 /100 | #144 | Excellent 11.0% |
| Hungarians | 85.1 /100 | #145 | Excellent 11.0% |
| Taiwanese | 84.2 /100 | #146 | Excellent 11.0% |
| Whites/Caucasians | 83.9 /100 | #147 | Excellent 11.1% |
| Immigrants | South Eastern Asia | 83.3 /100 | #148 | Excellent 11.1% |
| Brazilians | 83.2 /100 | #149 | Excellent 11.1% |
| Soviet Union | 83.1 /100 | #150 | Excellent 11.1% |
| Immigrants | Spain | 81.7 /100 | #151 | Excellent 11.1% |
| Immigrants | Kazakhstan | 81.7 /100 | #152 | Excellent 11.1% |
| Lebanese | 81.6 /100 | #153 | Excellent 11.1% |
| Armenians | 81.4 /100 | #154 | Excellent 11.1% |
| Immigrants | Argentina | 80.4 /100 | #155 | Excellent 11.2% |
| Immigrants | Afghanistan | 75.6 /100 | #156 | Good 11.3% |