Ukrainian vs Immigrants from Asia Receiving Food Stamps
COMPARE
Ukrainian
Immigrants from Asia
Receiving Food Stamps
Receiving Food Stamps Comparison
Ukrainians
Immigrants from Asia
10.7%
RECEIVING FOOD STAMPS
92.8/ 100
METRIC RATING
125th/ 347
METRIC RANK
9.9%
RECEIVING FOOD STAMPS
98.9/ 100
METRIC RATING
72nd/ 347
METRIC RANK
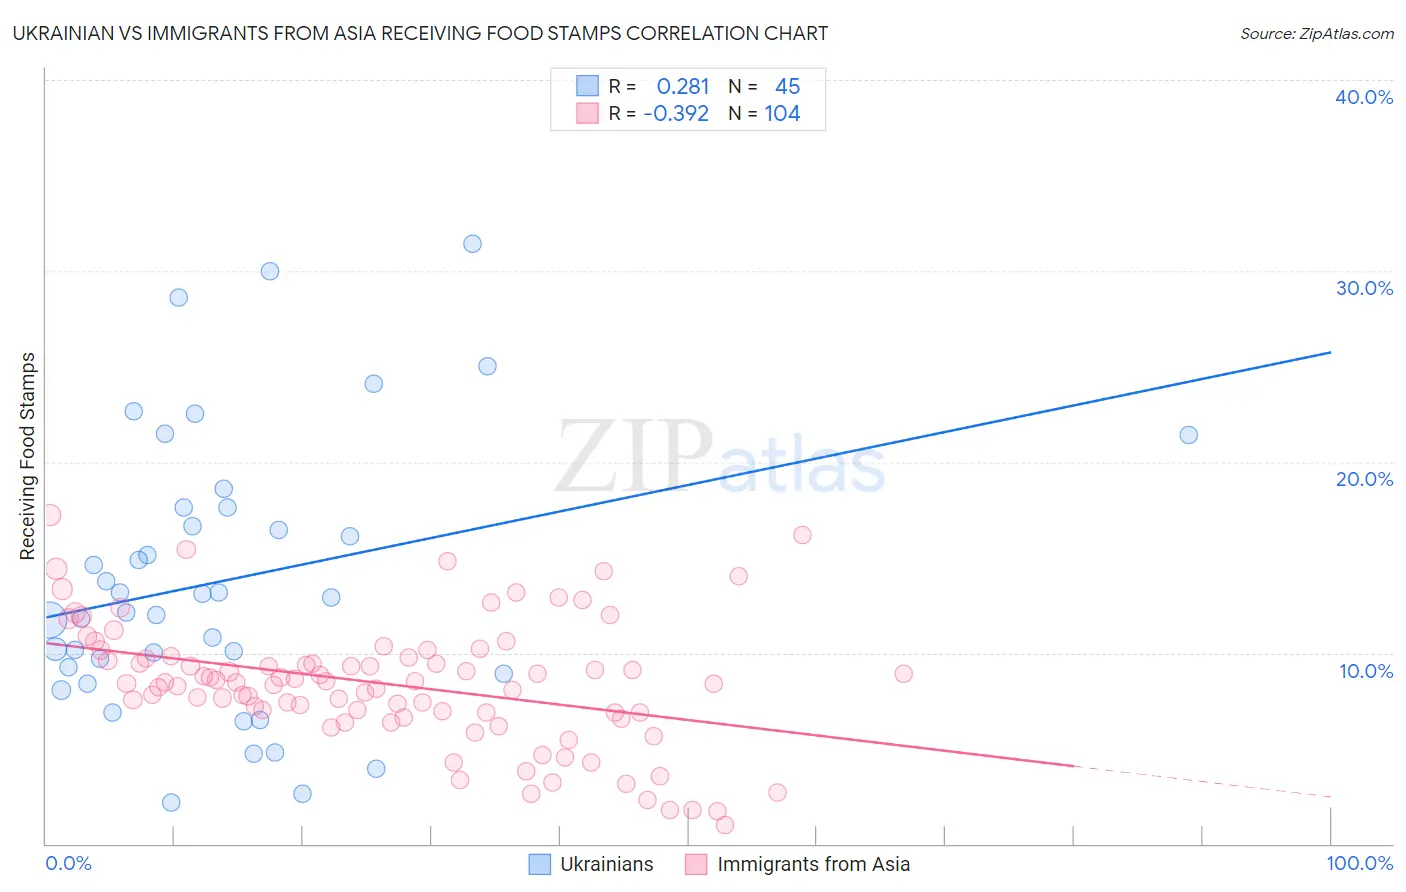
Ukrainian vs Immigrants from Asia Receiving Food Stamps Correlation Chart
The statistical analysis conducted on geographies consisting of 446,698,420 people shows a weak positive correlation between the proportion of Ukrainians and percentage of population receiving government assistance and/or food stamps in the United States with a correlation coefficient (R) of 0.281 and weighted average of 10.7%. Similarly, the statistical analysis conducted on geographies consisting of 546,090,364 people shows a mild negative correlation between the proportion of Immigrants from Asia and percentage of population receiving government assistance and/or food stamps in the United States with a correlation coefficient (R) of -0.392 and weighted average of 9.9%, a difference of 8.0%.
Receiving Food Stamps Correlation Summary
| Measurement | Ukrainian | Immigrants from Asia |
| Minimum | 2.2% | 1.0% |
| Maximum | 31.4% | 17.2% |
| Range | 29.2% | 16.2% |
| Mean | 13.8% | 8.4% |
| Median | 12.9% | 8.4% |
| Interquartile 25% (IQ1) | 9.1% | 6.9% |
| Interquartile 75% (IQ3) | 17.6% | 9.8% |
| Interquartile Range (IQR) | 8.5% | 2.9% |
| Standard Deviation (Sample) | 7.2% | 3.3% |
| Standard Deviation (Population) | 7.1% | 3.3% |
Similar Demographics by Receiving Food Stamps
Demographics Similar to Ukrainians by Receiving Food Stamps
In terms of receiving food stamps, the demographic groups most similar to Ukrainians are Paraguayan (10.7%, a difference of 0.080%), Afghan (10.7%, a difference of 0.14%), Immigrants from Ethiopia (10.7%, a difference of 0.16%), Immigrants from Jordan (10.7%, a difference of 0.17%), and Yugoslavian (10.7%, a difference of 0.17%).
| Demographics | Rating | Rank | Receiving Food Stamps |
| Assyrians/Chaldeans/Syriacs | 94.1 /100 | #118 | Exceptional 10.6% |
| Immigrants | Poland | 93.9 /100 | #119 | Exceptional 10.6% |
| Ethiopians | 93.9 /100 | #120 | Exceptional 10.6% |
| Slavs | 93.8 /100 | #121 | Exceptional 10.6% |
| Sri Lankans | 93.7 /100 | #122 | Exceptional 10.6% |
| Immigrants | Philippines | 93.3 /100 | #123 | Exceptional 10.7% |
| Paraguayans | 93.0 /100 | #124 | Exceptional 10.7% |
| Ukrainians | 92.8 /100 | #125 | Exceptional 10.7% |
| Afghans | 92.6 /100 | #126 | Exceptional 10.7% |
| Immigrants | Ethiopia | 92.6 /100 | #127 | Exceptional 10.7% |
| Immigrants | Jordan | 92.5 /100 | #128 | Exceptional 10.7% |
| Yugoslavians | 92.5 /100 | #129 | Exceptional 10.7% |
| Israelis | 92.4 /100 | #130 | Exceptional 10.7% |
| French | 92.3 /100 | #131 | Exceptional 10.7% |
| Immigrants | Germany | 92.0 /100 | #132 | Exceptional 10.7% |
Demographics Similar to Immigrants from Asia by Receiving Food Stamps
In terms of receiving food stamps, the demographic groups most similar to Immigrants from Asia are Macedonian (9.9%, a difference of 0.060%), New Zealander (9.9%, a difference of 0.23%), Scottish (9.9%, a difference of 0.24%), Immigrants from Serbia (9.9%, a difference of 0.37%), and Italian (9.9%, a difference of 0.42%).
| Demographics | Rating | Rank | Receiving Food Stamps |
| Immigrants | Turkey | 99.1 /100 | #65 | Exceptional 9.8% |
| Slovenes | 99.1 /100 | #66 | Exceptional 9.8% |
| Immigrants | Indonesia | 99.0 /100 | #67 | Exceptional 9.8% |
| Northern Europeans | 99.0 /100 | #68 | Exceptional 9.8% |
| Italians | 99.0 /100 | #69 | Exceptional 9.9% |
| Immigrants | Serbia | 99.0 /100 | #70 | Exceptional 9.9% |
| Scottish | 98.9 /100 | #71 | Exceptional 9.9% |
| Immigrants | Asia | 98.9 /100 | #72 | Exceptional 9.9% |
| Macedonians | 98.9 /100 | #73 | Exceptional 9.9% |
| New Zealanders | 98.8 /100 | #74 | Exceptional 9.9% |
| Immigrants | Zimbabwe | 98.7 /100 | #75 | Exceptional 9.9% |
| Immigrants | Croatia | 98.7 /100 | #76 | Exceptional 10.0% |
| Immigrants | North Macedonia | 98.7 /100 | #77 | Exceptional 10.0% |
| South Africans | 98.7 /100 | #78 | Exceptional 10.0% |
| Laotians | 98.7 /100 | #79 | Exceptional 10.0% |