Ugandan vs Immigrants from Senegal Single Mother Poverty
COMPARE
Ugandan
Immigrants from Senegal
Single Mother Poverty
Single Mother Poverty Comparison
Ugandans
Immigrants from Senegal
28.8%
SINGLE MOTHER POVERTY
71.7/ 100
METRIC RATING
155th/ 347
METRIC RANK
31.5%
SINGLE MOTHER POVERTY
0.1/ 100
METRIC RATING
268th/ 347
METRIC RANK
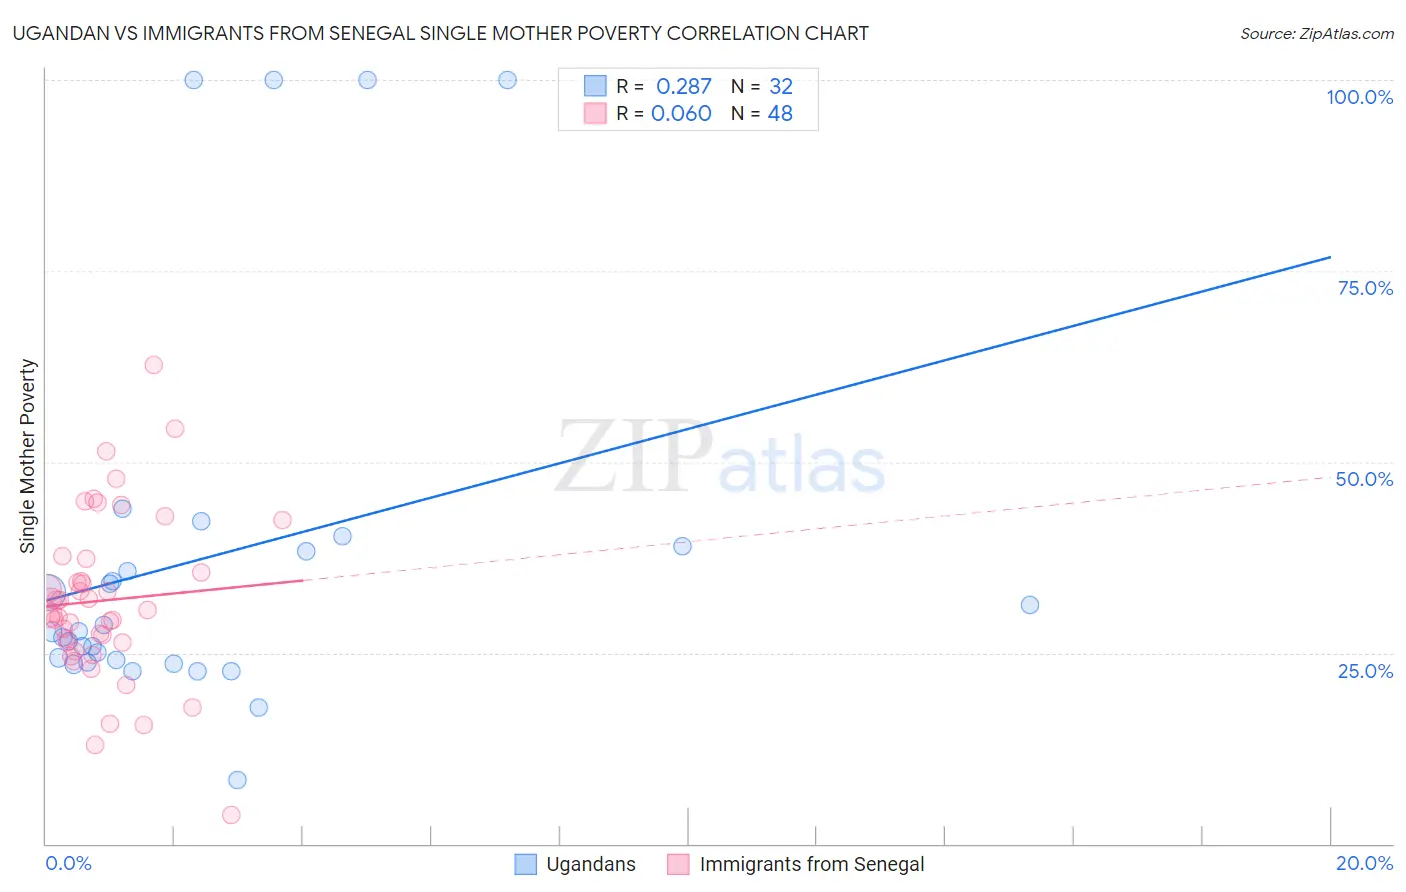
Ugandan vs Immigrants from Senegal Single Mother Poverty Correlation Chart
The statistical analysis conducted on geographies consisting of 93,563,959 people shows a weak positive correlation between the proportion of Ugandans and poverty level among single mothers in the United States with a correlation coefficient (R) of 0.287 and weighted average of 28.8%. Similarly, the statistical analysis conducted on geographies consisting of 89,735,175 people shows a slight positive correlation between the proportion of Immigrants from Senegal and poverty level among single mothers in the United States with a correlation coefficient (R) of 0.060 and weighted average of 31.5%, a difference of 9.1%.
Single Mother Poverty Correlation Summary
| Measurement | Ugandan | Immigrants from Senegal |
| Minimum | 8.4% | 3.8% |
| Maximum | 100.0% | 62.7% |
| Range | 91.6% | 58.9% |
| Mean | 37.5% | 31.8% |
| Median | 27.8% | 30.4% |
| Interquartile 25% (IQ1) | 23.9% | 26.3% |
| Interquartile 75% (IQ3) | 38.6% | 36.4% |
| Interquartile Range (IQR) | 14.7% | 10.1% |
| Standard Deviation (Sample) | 25.1% | 10.9% |
| Standard Deviation (Population) | 24.7% | 10.8% |
Similar Demographics by Single Mother Poverty
Demographics Similar to Ugandans by Single Mother Poverty
In terms of single mother poverty, the demographic groups most similar to Ugandans are Iraqi (28.8%, a difference of 0.010%), Immigrants from Western Europe (28.9%, a difference of 0.040%), Immigrants from Hungary (28.9%, a difference of 0.070%), Portuguese (28.8%, a difference of 0.090%), and Czech (28.9%, a difference of 0.19%).
| Demographics | Rating | Rank | Single Mother Poverty |
| Syrians | 85.3 /100 | #148 | Excellent 28.6% |
| Serbians | 85.0 /100 | #149 | Excellent 28.6% |
| Northern Europeans | 81.7 /100 | #150 | Excellent 28.6% |
| Immigrants | Oceania | 79.9 /100 | #151 | Good 28.7% |
| Austrians | 79.0 /100 | #152 | Good 28.7% |
| Slovenes | 76.4 /100 | #153 | Good 28.8% |
| Portuguese | 73.2 /100 | #154 | Good 28.8% |
| Ugandans | 71.7 /100 | #155 | Good 28.8% |
| Iraqis | 71.5 /100 | #156 | Good 28.8% |
| Immigrants | Western Europe | 71.1 /100 | #157 | Good 28.9% |
| Immigrants | Hungary | 70.6 /100 | #158 | Good 28.9% |
| Czechs | 68.4 /100 | #159 | Good 28.9% |
| Japanese | 68.0 /100 | #160 | Good 28.9% |
| Immigrants | Cambodia | 66.6 /100 | #161 | Good 28.9% |
| Scandinavians | 66.2 /100 | #162 | Good 28.9% |
Demographics Similar to Immigrants from Senegal by Single Mother Poverty
In terms of single mother poverty, the demographic groups most similar to Immigrants from Senegal are Scotch-Irish (31.5%, a difference of 0.040%), British West Indian (31.5%, a difference of 0.090%), Immigrants from Belize (31.4%, a difference of 0.18%), Subsaharan African (31.4%, a difference of 0.33%), and Immigrants from Cabo Verde (31.6%, a difference of 0.33%).
| Demographics | Rating | Rank | Single Mother Poverty |
| Immigrants | El Salvador | 0.3 /100 | #261 | Tragic 31.2% |
| Hmong | 0.3 /100 | #262 | Tragic 31.2% |
| Bahamians | 0.2 /100 | #263 | Tragic 31.3% |
| Immigrants | Ecuador | 0.2 /100 | #264 | Tragic 31.3% |
| German Russians | 0.2 /100 | #265 | Tragic 31.3% |
| Sub-Saharan Africans | 0.2 /100 | #266 | Tragic 31.4% |
| Immigrants | Belize | 0.2 /100 | #267 | Tragic 31.4% |
| Immigrants | Senegal | 0.1 /100 | #268 | Tragic 31.5% |
| Scotch-Irish | 0.1 /100 | #269 | Tragic 31.5% |
| British West Indians | 0.1 /100 | #270 | Tragic 31.5% |
| Immigrants | Cabo Verde | 0.1 /100 | #271 | Tragic 31.6% |
| Immigrants | Micronesia | 0.1 /100 | #272 | Tragic 31.6% |
| Fijians | 0.1 /100 | #273 | Tragic 31.6% |
| Bangladeshis | 0.1 /100 | #274 | Tragic 31.7% |
| Central Americans | 0.1 /100 | #275 | Tragic 31.8% |