Ugandan vs Polish Single Mother Poverty
COMPARE
Ugandan
Polish
Single Mother Poverty
Single Mother Poverty Comparison
Ugandans
Poles
28.8%
SINGLE MOTHER POVERTY
71.7/ 100
METRIC RATING
155th/ 347
METRIC RANK
28.4%
SINGLE MOTHER POVERTY
90.8/ 100
METRIC RATING
127th/ 347
METRIC RANK
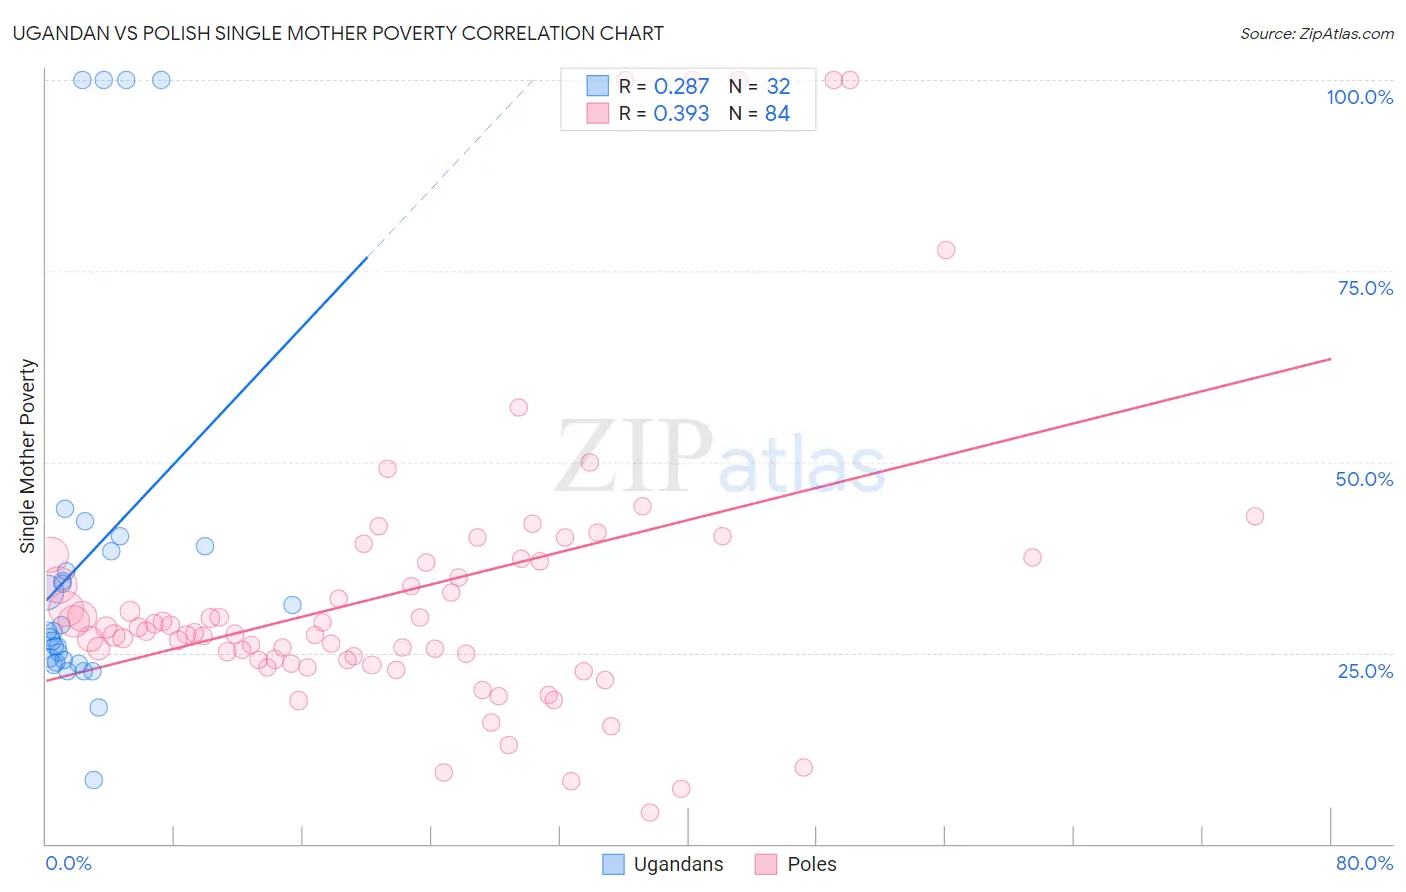
Ugandan vs Polish Single Mother Poverty Correlation Chart
The statistical analysis conducted on geographies consisting of 93,563,959 people shows a weak positive correlation between the proportion of Ugandans and poverty level among single mothers in the United States with a correlation coefficient (R) of 0.287 and weighted average of 28.8%. Similarly, the statistical analysis conducted on geographies consisting of 533,048,223 people shows a mild positive correlation between the proportion of Poles and poverty level among single mothers in the United States with a correlation coefficient (R) of 0.393 and weighted average of 28.4%, a difference of 1.7%.
Single Mother Poverty Correlation Summary
| Measurement | Ugandan | Polish |
| Minimum | 8.4% | 4.1% |
| Maximum | 100.0% | 100.0% |
| Range | 91.6% | 95.9% |
| Mean | 37.5% | 33.1% |
| Median | 27.8% | 27.7% |
| Interquartile 25% (IQ1) | 23.9% | 24.1% |
| Interquartile 75% (IQ3) | 38.6% | 37.2% |
| Interquartile Range (IQR) | 14.7% | 13.1% |
| Standard Deviation (Sample) | 25.1% | 20.1% |
| Standard Deviation (Population) | 24.7% | 20.0% |
Similar Demographics by Single Mother Poverty
Demographics Similar to Ugandans by Single Mother Poverty
In terms of single mother poverty, the demographic groups most similar to Ugandans are Iraqi (28.8%, a difference of 0.010%), Immigrants from Western Europe (28.9%, a difference of 0.040%), Immigrants from Hungary (28.9%, a difference of 0.070%), Portuguese (28.8%, a difference of 0.090%), and Czech (28.9%, a difference of 0.19%).
| Demographics | Rating | Rank | Single Mother Poverty |
| Syrians | 85.3 /100 | #148 | Excellent 28.6% |
| Serbians | 85.0 /100 | #149 | Excellent 28.6% |
| Northern Europeans | 81.7 /100 | #150 | Excellent 28.6% |
| Immigrants | Oceania | 79.9 /100 | #151 | Good 28.7% |
| Austrians | 79.0 /100 | #152 | Good 28.7% |
| Slovenes | 76.4 /100 | #153 | Good 28.8% |
| Portuguese | 73.2 /100 | #154 | Good 28.8% |
| Ugandans | 71.7 /100 | #155 | Good 28.8% |
| Iraqis | 71.5 /100 | #156 | Good 28.8% |
| Immigrants | Western Europe | 71.1 /100 | #157 | Good 28.9% |
| Immigrants | Hungary | 70.6 /100 | #158 | Good 28.9% |
| Czechs | 68.4 /100 | #159 | Good 28.9% |
| Japanese | 68.0 /100 | #160 | Good 28.9% |
| Immigrants | Cambodia | 66.6 /100 | #161 | Good 28.9% |
| Scandinavians | 66.2 /100 | #162 | Good 28.9% |
Demographics Similar to Poles by Single Mother Poverty
In terms of single mother poverty, the demographic groups most similar to Poles are Immigrants from Chile (28.4%, a difference of 0.010%), Kenyan (28.4%, a difference of 0.020%), Immigrants from England (28.4%, a difference of 0.030%), South American (28.4%, a difference of 0.060%), and Norwegian (28.4%, a difference of 0.060%).
| Demographics | Rating | Rank | Single Mother Poverty |
| Cypriots | 92.3 /100 | #120 | Exceptional 28.3% |
| Immigrants | Afghanistan | 92.1 /100 | #121 | Exceptional 28.3% |
| Colombians | 91.8 /100 | #122 | Exceptional 28.3% |
| Uruguayans | 91.7 /100 | #123 | Exceptional 28.3% |
| Immigrants | Switzerland | 91.7 /100 | #124 | Exceptional 28.3% |
| Kenyans | 90.9 /100 | #125 | Exceptional 28.4% |
| Immigrants | Chile | 90.8 /100 | #126 | Exceptional 28.4% |
| Poles | 90.8 /100 | #127 | Exceptional 28.4% |
| Immigrants | England | 90.5 /100 | #128 | Exceptional 28.4% |
| South Americans | 90.4 /100 | #129 | Exceptional 28.4% |
| Norwegians | 90.4 /100 | #130 | Exceptional 28.4% |
| Immigrants | Austria | 90.3 /100 | #131 | Exceptional 28.4% |
| Immigrants | Morocco | 89.5 /100 | #132 | Excellent 28.4% |
| Swedes | 89.4 /100 | #133 | Excellent 28.4% |
| Immigrants | Southern Europe | 89.2 /100 | #134 | Excellent 28.4% |