Ugandan vs Immigrants from France Single Mother Poverty
COMPARE
Ugandan
Immigrants from France
Single Mother Poverty
Single Mother Poverty Comparison
Ugandans
Immigrants from France
28.8%
SINGLE MOTHER POVERTY
71.7/ 100
METRIC RATING
155th/ 347
METRIC RANK
27.8%
SINGLE MOTHER POVERTY
98.2/ 100
METRIC RATING
90th/ 347
METRIC RANK
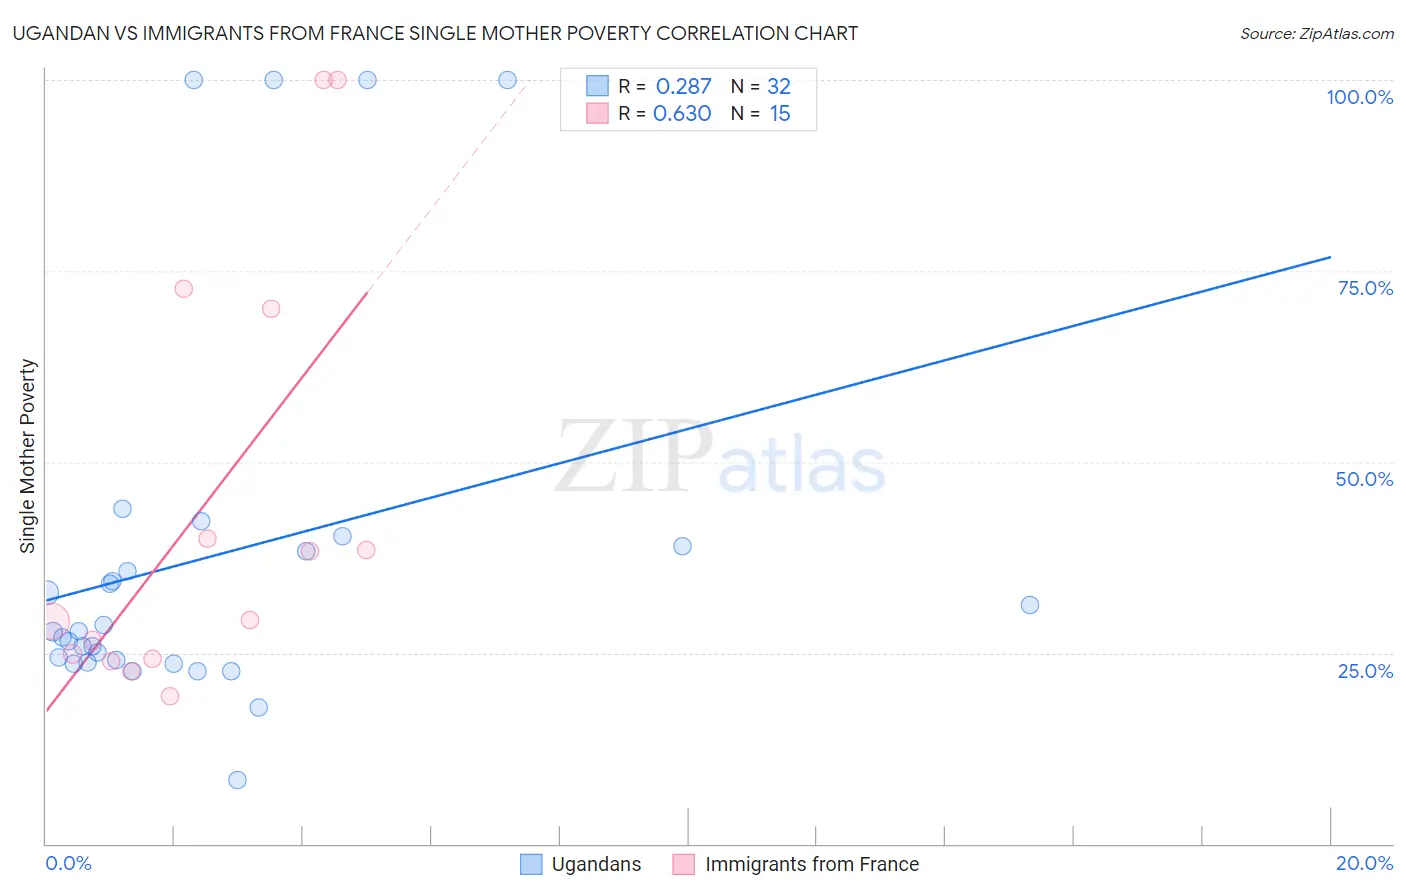
Ugandan vs Immigrants from France Single Mother Poverty Correlation Chart
The statistical analysis conducted on geographies consisting of 93,563,959 people shows a weak positive correlation between the proportion of Ugandans and poverty level among single mothers in the United States with a correlation coefficient (R) of 0.287 and weighted average of 28.8%. Similarly, the statistical analysis conducted on geographies consisting of 281,639,013 people shows a significant positive correlation between the proportion of Immigrants from France and poverty level among single mothers in the United States with a correlation coefficient (R) of 0.630 and weighted average of 27.8%, a difference of 3.8%.
Single Mother Poverty Correlation Summary
| Measurement | Ugandan | Immigrants from France |
| Minimum | 8.4% | 19.4% |
| Maximum | 100.0% | 100.0% |
| Range | 91.6% | 80.6% |
| Mean | 37.5% | 44.0% |
| Median | 27.8% | 29.3% |
| Interquartile 25% (IQ1) | 23.9% | 24.3% |
| Interquartile 75% (IQ3) | 38.6% | 70.0% |
| Interquartile Range (IQR) | 14.7% | 45.7% |
| Standard Deviation (Sample) | 25.1% | 27.8% |
| Standard Deviation (Population) | 24.7% | 26.9% |
Similar Demographics by Single Mother Poverty
Demographics Similar to Ugandans by Single Mother Poverty
In terms of single mother poverty, the demographic groups most similar to Ugandans are Iraqi (28.8%, a difference of 0.010%), Immigrants from Western Europe (28.9%, a difference of 0.040%), Immigrants from Hungary (28.9%, a difference of 0.070%), Portuguese (28.8%, a difference of 0.090%), and Czech (28.9%, a difference of 0.19%).
| Demographics | Rating | Rank | Single Mother Poverty |
| Syrians | 85.3 /100 | #148 | Excellent 28.6% |
| Serbians | 85.0 /100 | #149 | Excellent 28.6% |
| Northern Europeans | 81.7 /100 | #150 | Excellent 28.6% |
| Immigrants | Oceania | 79.9 /100 | #151 | Good 28.7% |
| Austrians | 79.0 /100 | #152 | Good 28.7% |
| Slovenes | 76.4 /100 | #153 | Good 28.8% |
| Portuguese | 73.2 /100 | #154 | Good 28.8% |
| Ugandans | 71.7 /100 | #155 | Good 28.8% |
| Iraqis | 71.5 /100 | #156 | Good 28.8% |
| Immigrants | Western Europe | 71.1 /100 | #157 | Good 28.9% |
| Immigrants | Hungary | 70.6 /100 | #158 | Good 28.9% |
| Czechs | 68.4 /100 | #159 | Good 28.9% |
| Japanese | 68.0 /100 | #160 | Good 28.9% |
| Immigrants | Cambodia | 66.6 /100 | #161 | Good 28.9% |
| Scandinavians | 66.2 /100 | #162 | Good 28.9% |
Demographics Similar to Immigrants from France by Single Mother Poverty
In terms of single mother poverty, the demographic groups most similar to Immigrants from France are Immigrants from Albania (27.8%, a difference of 0.14%), Estonian (27.8%, a difference of 0.17%), Immigrants from Ethiopia (27.7%, a difference of 0.18%), Ethiopian (27.7%, a difference of 0.19%), and Afghan (27.7%, a difference of 0.21%).
| Demographics | Rating | Rank | Single Mother Poverty |
| Greeks | 98.7 /100 | #83 | Exceptional 27.7% |
| Immigrants | Latvia | 98.7 /100 | #84 | Exceptional 27.7% |
| Mongolians | 98.7 /100 | #85 | Exceptional 27.7% |
| Immigrants | Ukraine | 98.6 /100 | #86 | Exceptional 27.7% |
| Afghans | 98.5 /100 | #87 | Exceptional 27.7% |
| Ethiopians | 98.4 /100 | #88 | Exceptional 27.7% |
| Immigrants | Ethiopia | 98.4 /100 | #89 | Exceptional 27.7% |
| Immigrants | France | 98.2 /100 | #90 | Exceptional 27.8% |
| Immigrants | Albania | 98.0 /100 | #91 | Exceptional 27.8% |
| Estonians | 97.9 /100 | #92 | Exceptional 27.8% |
| Romanians | 97.8 /100 | #93 | Exceptional 27.8% |
| Albanians | 97.6 /100 | #94 | Exceptional 27.9% |
| Chileans | 97.5 /100 | #95 | Exceptional 27.9% |
| Immigrants | Iraq | 97.3 /100 | #96 | Exceptional 27.9% |
| Immigrants | Brazil | 97.2 /100 | #97 | Exceptional 27.9% |