Turkish vs Ghanaian Seniors Poverty Over the Age of 65
COMPARE
Turkish
Ghanaian
Seniors Poverty Over the Age of 65
Seniors Poverty Over the Age of 65 Comparison
Turks
Ghanaians
10.0%
SENIORS POVERTY OVER THE AGE OF 65
97.9/ 100
METRIC RATING
74th/ 347
METRIC RANK
12.4%
SENIORS POVERTY OVER THE AGE OF 65
0.2/ 100
METRIC RATING
259th/ 347
METRIC RANK
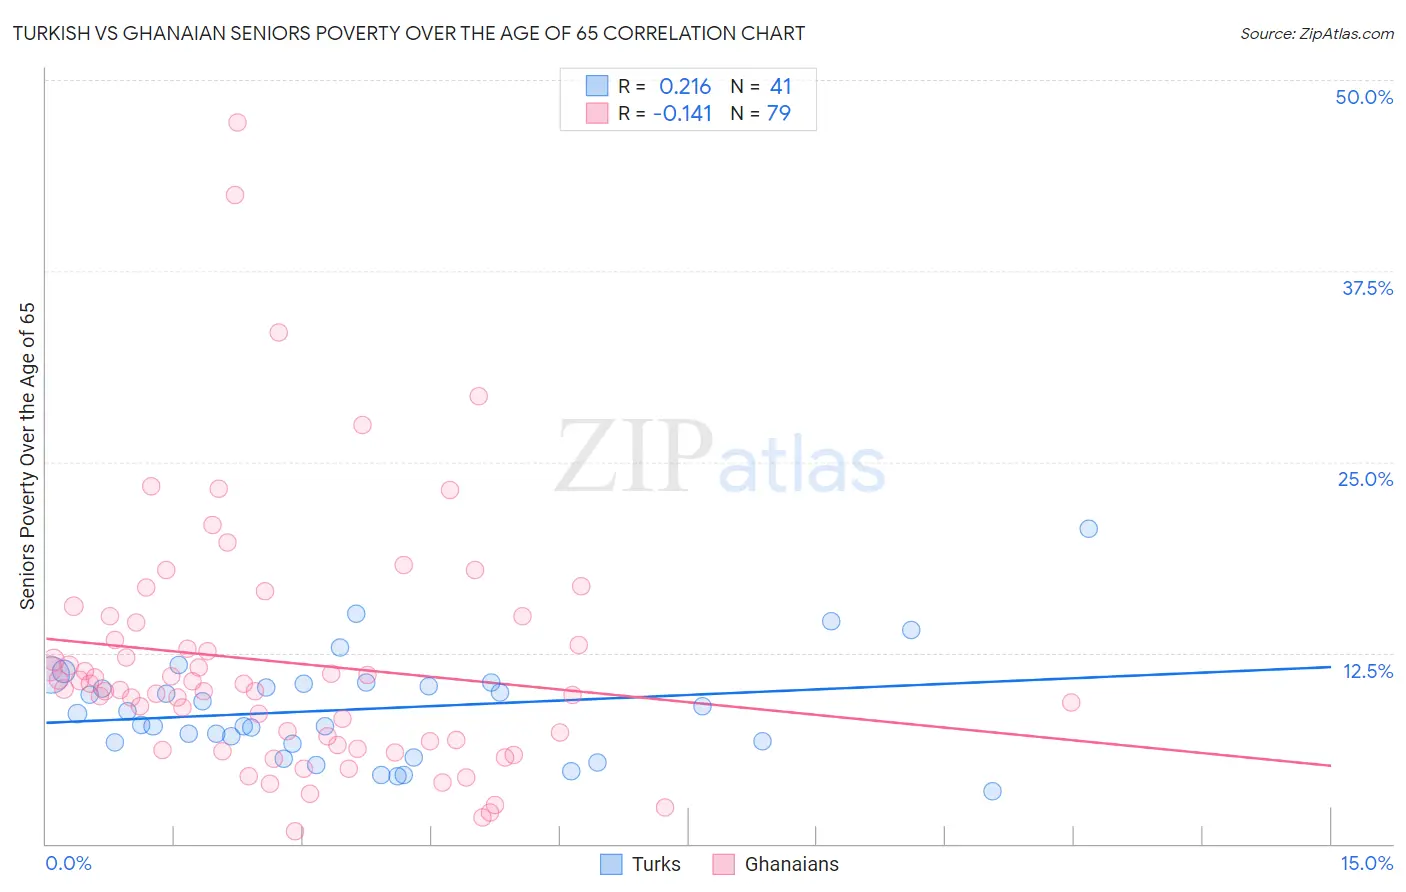
Turkish vs Ghanaian Seniors Poverty Over the Age of 65 Correlation Chart
The statistical analysis conducted on geographies consisting of 271,163,307 people shows a weak positive correlation between the proportion of Turks and poverty level among seniors over the age of 65 in the United States with a correlation coefficient (R) of 0.216 and weighted average of 10.0%. Similarly, the statistical analysis conducted on geographies consisting of 190,048,350 people shows a poor negative correlation between the proportion of Ghanaians and poverty level among seniors over the age of 65 in the United States with a correlation coefficient (R) of -0.141 and weighted average of 12.4%, a difference of 24.4%.
Seniors Poverty Over the Age of 65 Correlation Summary
| Measurement | Turkish | Ghanaian |
| Minimum | 3.5% | 0.81% |
| Maximum | 20.6% | 47.2% |
| Range | 17.1% | 46.4% |
| Mean | 8.8% | 11.9% |
| Median | 8.5% | 10.1% |
| Interquartile 25% (IQ1) | 6.6% | 6.5% |
| Interquartile 75% (IQ3) | 10.5% | 14.5% |
| Interquartile Range (IQR) | 3.9% | 8.0% |
| Standard Deviation (Sample) | 3.4% | 8.3% |
| Standard Deviation (Population) | 3.4% | 8.2% |
Similar Demographics by Seniors Poverty Over the Age of 65
Demographics Similar to Turks by Seniors Poverty Over the Age of 65
In terms of seniors poverty over the age of 65, the demographic groups most similar to Turks are Russian (10.0%, a difference of 0.020%), Palestinian (10.0%, a difference of 0.050%), Yugoslavian (10.0%, a difference of 0.070%), Immigrants from Czechoslovakia (10.0%, a difference of 0.090%), and Samoan (10.0%, a difference of 0.11%).
| Demographics | Rating | Rank | Seniors Poverty Over the Age of 65 |
| Immigrants | Austria | 98.6 /100 | #67 | Exceptional 9.9% |
| Canadians | 98.5 /100 | #68 | Exceptional 9.9% |
| Australians | 98.4 /100 | #69 | Exceptional 9.9% |
| Samoans | 98.0 /100 | #70 | Exceptional 10.0% |
| Yugoslavians | 97.9 /100 | #71 | Exceptional 10.0% |
| Palestinians | 97.9 /100 | #72 | Exceptional 10.0% |
| Russians | 97.9 /100 | #73 | Exceptional 10.0% |
| Turks | 97.9 /100 | #74 | Exceptional 10.0% |
| Immigrants | Czechoslovakia | 97.8 /100 | #75 | Exceptional 10.0% |
| New Zealanders | 97.7 /100 | #76 | Exceptional 10.0% |
| Immigrants | South Africa | 97.7 /100 | #77 | Exceptional 10.0% |
| Whites/Caucasians | 97.5 /100 | #78 | Exceptional 10.0% |
| Immigrants | Ireland | 97.5 /100 | #79 | Exceptional 10.0% |
| Koreans | 97.4 /100 | #80 | Exceptional 10.1% |
| Immigrants | Sri Lanka | 97.3 /100 | #81 | Exceptional 10.1% |
Demographics Similar to Ghanaians by Seniors Poverty Over the Age of 65
In terms of seniors poverty over the age of 65, the demographic groups most similar to Ghanaians are Dutch West Indian (12.4%, a difference of 0.030%), South American (12.5%, a difference of 0.24%), Immigrants from Panama (12.4%, a difference of 0.28%), Immigrants (12.4%, a difference of 0.28%), and Colombian (12.5%, a difference of 0.48%).
| Demographics | Rating | Rank | Seniors Poverty Over the Age of 65 |
| Armenians | 0.3 /100 | #252 | Tragic 12.3% |
| Shoshone | 0.3 /100 | #253 | Tragic 12.3% |
| Immigrants | Cambodia | 0.3 /100 | #254 | Tragic 12.4% |
| Mexican American Indians | 0.3 /100 | #255 | Tragic 12.4% |
| Immigrants | Panama | 0.2 /100 | #256 | Tragic 12.4% |
| Immigrants | Immigrants | 0.2 /100 | #257 | Tragic 12.4% |
| Dutch West Indians | 0.2 /100 | #258 | Tragic 12.4% |
| Ghanaians | 0.2 /100 | #259 | Tragic 12.4% |
| South Americans | 0.2 /100 | #260 | Tragic 12.5% |
| Colombians | 0.2 /100 | #261 | Tragic 12.5% |
| Venezuelans | 0.1 /100 | #262 | Tragic 12.5% |
| Soviet Union | 0.1 /100 | #263 | Tragic 12.6% |
| Inupiat | 0.1 /100 | #264 | Tragic 12.6% |
| Immigrants | Western Africa | 0.1 /100 | #265 | Tragic 12.6% |
| Africans | 0.1 /100 | #266 | Tragic 12.6% |