Immigrants from Thailand vs Ghanaian Seniors Poverty Over the Age of 65
COMPARE
Immigrants from Thailand
Ghanaian
Seniors Poverty Over the Age of 65
Seniors Poverty Over the Age of 65 Comparison
Immigrants from Thailand
Ghanaians
11.0%
SENIORS POVERTY OVER THE AGE OF 65
43.5/ 100
METRIC RATING
180th/ 347
METRIC RANK
12.4%
SENIORS POVERTY OVER THE AGE OF 65
0.2/ 100
METRIC RATING
259th/ 347
METRIC RANK
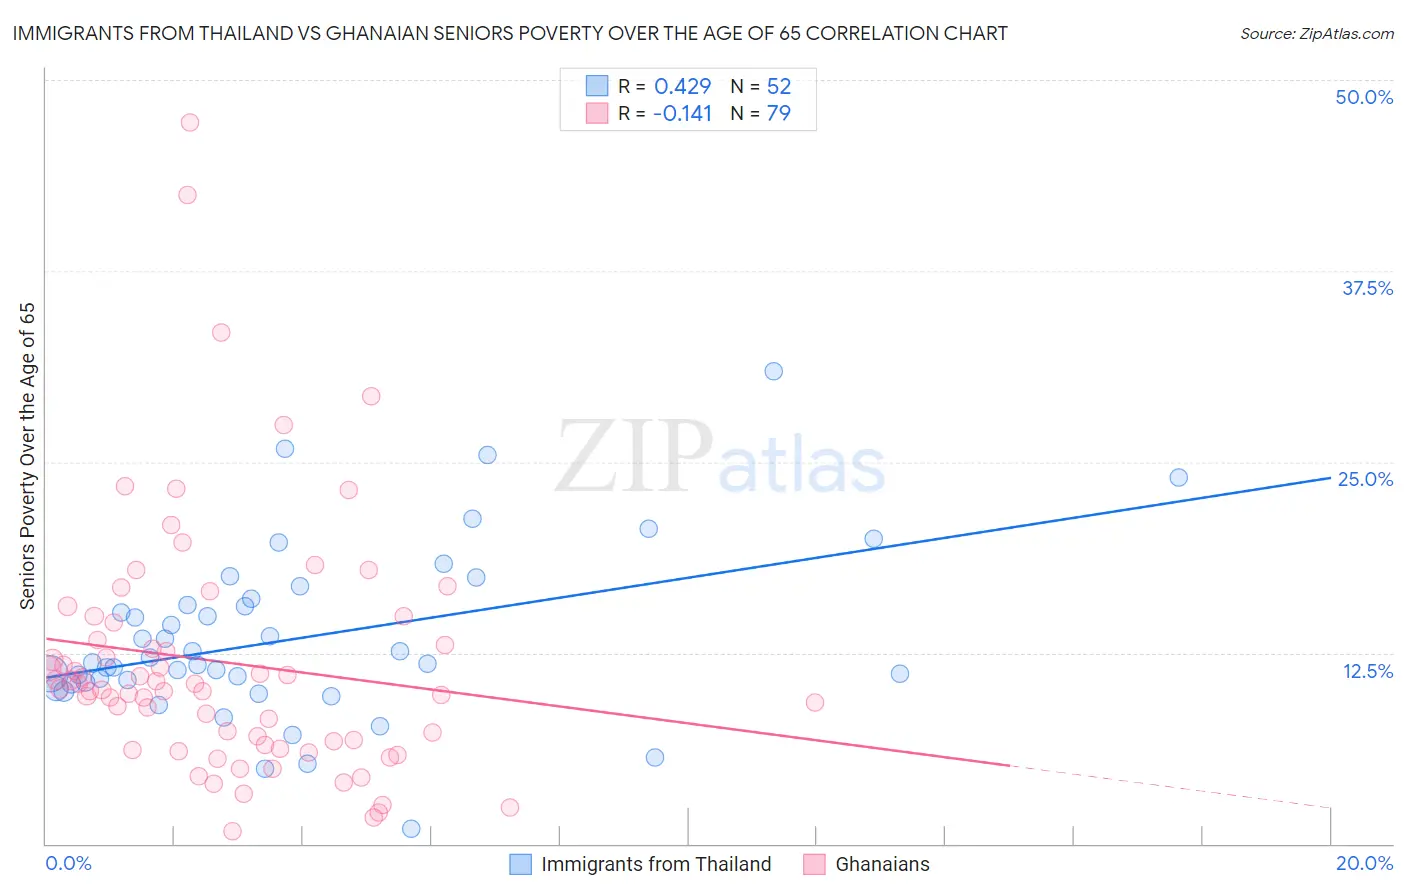
Immigrants from Thailand vs Ghanaian Seniors Poverty Over the Age of 65 Correlation Chart
The statistical analysis conducted on geographies consisting of 316,238,604 people shows a moderate positive correlation between the proportion of Immigrants from Thailand and poverty level among seniors over the age of 65 in the United States with a correlation coefficient (R) of 0.429 and weighted average of 11.0%. Similarly, the statistical analysis conducted on geographies consisting of 190,048,350 people shows a poor negative correlation between the proportion of Ghanaians and poverty level among seniors over the age of 65 in the United States with a correlation coefficient (R) of -0.141 and weighted average of 12.4%, a difference of 13.2%.
Seniors Poverty Over the Age of 65 Correlation Summary
| Measurement | Immigrants from Thailand | Ghanaian |
| Minimum | 0.97% | 0.81% |
| Maximum | 30.9% | 47.2% |
| Range | 29.9% | 46.4% |
| Mean | 13.4% | 11.9% |
| Median | 11.8% | 10.1% |
| Interquartile 25% (IQ1) | 10.5% | 6.5% |
| Interquartile 75% (IQ3) | 15.8% | 14.5% |
| Interquartile Range (IQR) | 5.3% | 8.0% |
| Standard Deviation (Sample) | 5.6% | 8.3% |
| Standard Deviation (Population) | 5.6% | 8.2% |
Similar Demographics by Seniors Poverty Over the Age of 65
Demographics Similar to Immigrants from Thailand by Seniors Poverty Over the Age of 65
In terms of seniors poverty over the age of 65, the demographic groups most similar to Immigrants from Thailand are Immigrants from Eastern Africa (11.0%, a difference of 0.0%), Immigrants from Northern Africa (11.0%, a difference of 0.10%), Immigrants from Fiji (11.0%, a difference of 0.13%), Immigrants from Kazakhstan (11.0%, a difference of 0.23%), and Immigrants from France (11.0%, a difference of 0.23%).
| Demographics | Rating | Rank | Seniors Poverty Over the Age of 65 |
| Spaniards | 50.7 /100 | #173 | Average 10.9% |
| Immigrants | Sudan | 50.0 /100 | #174 | Average 10.9% |
| Creek | 49.6 /100 | #175 | Average 10.9% |
| Immigrants | Malaysia | 47.9 /100 | #176 | Average 11.0% |
| Cherokee | 47.3 /100 | #177 | Average 11.0% |
| German Russians | 46.9 /100 | #178 | Average 11.0% |
| Immigrants | Northern Africa | 44.6 /100 | #179 | Average 11.0% |
| Immigrants | Thailand | 43.5 /100 | #180 | Average 11.0% |
| Immigrants | Eastern Africa | 43.4 /100 | #181 | Average 11.0% |
| Immigrants | Fiji | 42.0 /100 | #182 | Average 11.0% |
| Immigrants | Kazakhstan | 41.0 /100 | #183 | Average 11.0% |
| Immigrants | France | 40.9 /100 | #184 | Average 11.0% |
| Immigrants | Lebanon | 38.2 /100 | #185 | Fair 11.1% |
| Immigrants | Eastern Asia | 37.5 /100 | #186 | Fair 11.1% |
| Immigrants | Middle Africa | 37.4 /100 | #187 | Fair 11.1% |
Demographics Similar to Ghanaians by Seniors Poverty Over the Age of 65
In terms of seniors poverty over the age of 65, the demographic groups most similar to Ghanaians are Dutch West Indian (12.4%, a difference of 0.030%), South American (12.5%, a difference of 0.24%), Immigrants from Panama (12.4%, a difference of 0.28%), Immigrants (12.4%, a difference of 0.28%), and Colombian (12.5%, a difference of 0.48%).
| Demographics | Rating | Rank | Seniors Poverty Over the Age of 65 |
| Armenians | 0.3 /100 | #252 | Tragic 12.3% |
| Shoshone | 0.3 /100 | #253 | Tragic 12.3% |
| Immigrants | Cambodia | 0.3 /100 | #254 | Tragic 12.4% |
| Mexican American Indians | 0.3 /100 | #255 | Tragic 12.4% |
| Immigrants | Panama | 0.2 /100 | #256 | Tragic 12.4% |
| Immigrants | Immigrants | 0.2 /100 | #257 | Tragic 12.4% |
| Dutch West Indians | 0.2 /100 | #258 | Tragic 12.4% |
| Ghanaians | 0.2 /100 | #259 | Tragic 12.4% |
| South Americans | 0.2 /100 | #260 | Tragic 12.5% |
| Colombians | 0.2 /100 | #261 | Tragic 12.5% |
| Venezuelans | 0.1 /100 | #262 | Tragic 12.5% |
| Soviet Union | 0.1 /100 | #263 | Tragic 12.6% |
| Inupiat | 0.1 /100 | #264 | Tragic 12.6% |
| Immigrants | Western Africa | 0.1 /100 | #265 | Tragic 12.6% |
| Africans | 0.1 /100 | #266 | Tragic 12.6% |