Immigrants from Latvia vs Ghanaian Seniors Poverty Over the Age of 65
COMPARE
Immigrants from Latvia
Ghanaian
Seniors Poverty Over the Age of 65
Seniors Poverty Over the Age of 65 Comparison
Immigrants from Latvia
Ghanaians
10.5%
SENIORS POVERTY OVER THE AGE OF 65
84.7/ 100
METRIC RATING
138th/ 347
METRIC RANK
12.4%
SENIORS POVERTY OVER THE AGE OF 65
0.2/ 100
METRIC RATING
259th/ 347
METRIC RANK
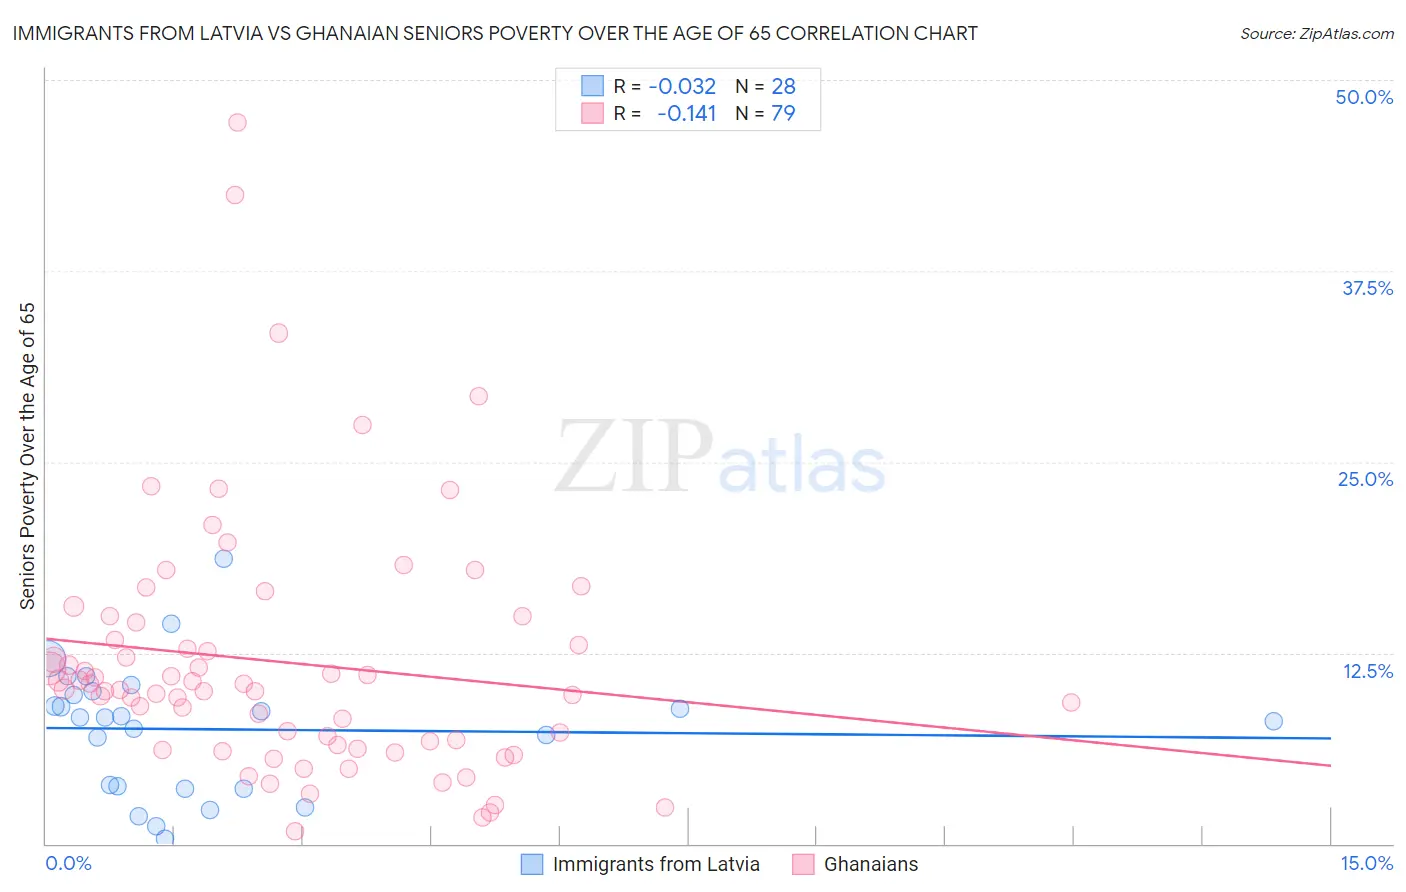
Immigrants from Latvia vs Ghanaian Seniors Poverty Over the Age of 65 Correlation Chart
The statistical analysis conducted on geographies consisting of 113,653,764 people shows no correlation between the proportion of Immigrants from Latvia and poverty level among seniors over the age of 65 in the United States with a correlation coefficient (R) of -0.032 and weighted average of 10.5%. Similarly, the statistical analysis conducted on geographies consisting of 190,048,350 people shows a poor negative correlation between the proportion of Ghanaians and poverty level among seniors over the age of 65 in the United States with a correlation coefficient (R) of -0.141 and weighted average of 12.4%, a difference of 18.3%.
Seniors Poverty Over the Age of 65 Correlation Summary
| Measurement | Immigrants from Latvia | Ghanaian |
| Minimum | 0.37% | 0.81% |
| Maximum | 18.6% | 47.2% |
| Range | 18.3% | 46.4% |
| Mean | 7.5% | 11.9% |
| Median | 8.3% | 10.1% |
| Interquartile 25% (IQ1) | 3.7% | 6.5% |
| Interquartile 75% (IQ3) | 9.9% | 14.5% |
| Interquartile Range (IQR) | 6.2% | 8.0% |
| Standard Deviation (Sample) | 4.2% | 8.3% |
| Standard Deviation (Population) | 4.2% | 8.2% |
Similar Demographics by Seniors Poverty Over the Age of 65
Demographics Similar to Immigrants from Latvia by Seniors Poverty Over the Age of 65
In terms of seniors poverty over the age of 65, the demographic groups most similar to Immigrants from Latvia are Immigrants from Australia (10.5%, a difference of 0.060%), Portuguese (10.5%, a difference of 0.10%), Immigrants from Kenya (10.5%, a difference of 0.23%), Immigrants from Europe (10.5%, a difference of 0.25%), and Immigrants from Serbia (10.5%, a difference of 0.32%).
| Demographics | Rating | Rank | Seniors Poverty Over the Age of 65 |
| Egyptians | 87.8 /100 | #131 | Excellent 10.5% |
| Immigrants | Turkey | 87.7 /100 | #132 | Excellent 10.5% |
| Guamanians/Chamorros | 87.5 /100 | #133 | Excellent 10.5% |
| Sierra Leoneans | 86.8 /100 | #134 | Excellent 10.5% |
| Immigrants | Norway | 86.5 /100 | #135 | Excellent 10.5% |
| Immigrants | Serbia | 86.4 /100 | #136 | Excellent 10.5% |
| Immigrants | Australia | 85.1 /100 | #137 | Excellent 10.5% |
| Immigrants | Latvia | 84.7 /100 | #138 | Excellent 10.5% |
| Portuguese | 84.1 /100 | #139 | Excellent 10.5% |
| Immigrants | Kenya | 83.4 /100 | #140 | Excellent 10.5% |
| Immigrants | Europe | 83.3 /100 | #141 | Excellent 10.5% |
| Osage | 82.8 /100 | #142 | Excellent 10.6% |
| Immigrants | Asia | 80.8 /100 | #143 | Excellent 10.6% |
| Iraqis | 80.7 /100 | #144 | Excellent 10.6% |
| Laotians | 79.9 /100 | #145 | Good 10.6% |
Demographics Similar to Ghanaians by Seniors Poverty Over the Age of 65
In terms of seniors poverty over the age of 65, the demographic groups most similar to Ghanaians are Dutch West Indian (12.4%, a difference of 0.030%), South American (12.5%, a difference of 0.24%), Immigrants from Panama (12.4%, a difference of 0.28%), Immigrants (12.4%, a difference of 0.28%), and Colombian (12.5%, a difference of 0.48%).
| Demographics | Rating | Rank | Seniors Poverty Over the Age of 65 |
| Armenians | 0.3 /100 | #252 | Tragic 12.3% |
| Shoshone | 0.3 /100 | #253 | Tragic 12.3% |
| Immigrants | Cambodia | 0.3 /100 | #254 | Tragic 12.4% |
| Mexican American Indians | 0.3 /100 | #255 | Tragic 12.4% |
| Immigrants | Panama | 0.2 /100 | #256 | Tragic 12.4% |
| Immigrants | Immigrants | 0.2 /100 | #257 | Tragic 12.4% |
| Dutch West Indians | 0.2 /100 | #258 | Tragic 12.4% |
| Ghanaians | 0.2 /100 | #259 | Tragic 12.4% |
| South Americans | 0.2 /100 | #260 | Tragic 12.5% |
| Colombians | 0.2 /100 | #261 | Tragic 12.5% |
| Venezuelans | 0.1 /100 | #262 | Tragic 12.5% |
| Soviet Union | 0.1 /100 | #263 | Tragic 12.6% |
| Inupiat | 0.1 /100 | #264 | Tragic 12.6% |
| Immigrants | Western Africa | 0.1 /100 | #265 | Tragic 12.6% |
| Africans | 0.1 /100 | #266 | Tragic 12.6% |