Tsimshian vs Somali High School Diploma
COMPARE
Tsimshian
Somali
High School Diploma
High School Diploma Comparison
Tsimshian
Somalis
91.3%
HIGH SCHOOL DIPLOMA
99.9/ 100
METRIC RATING
36th/ 347
METRIC RANK
88.6%
HIGH SCHOOL DIPLOMA
17.5/ 100
METRIC RATING
203rd/ 347
METRIC RANK
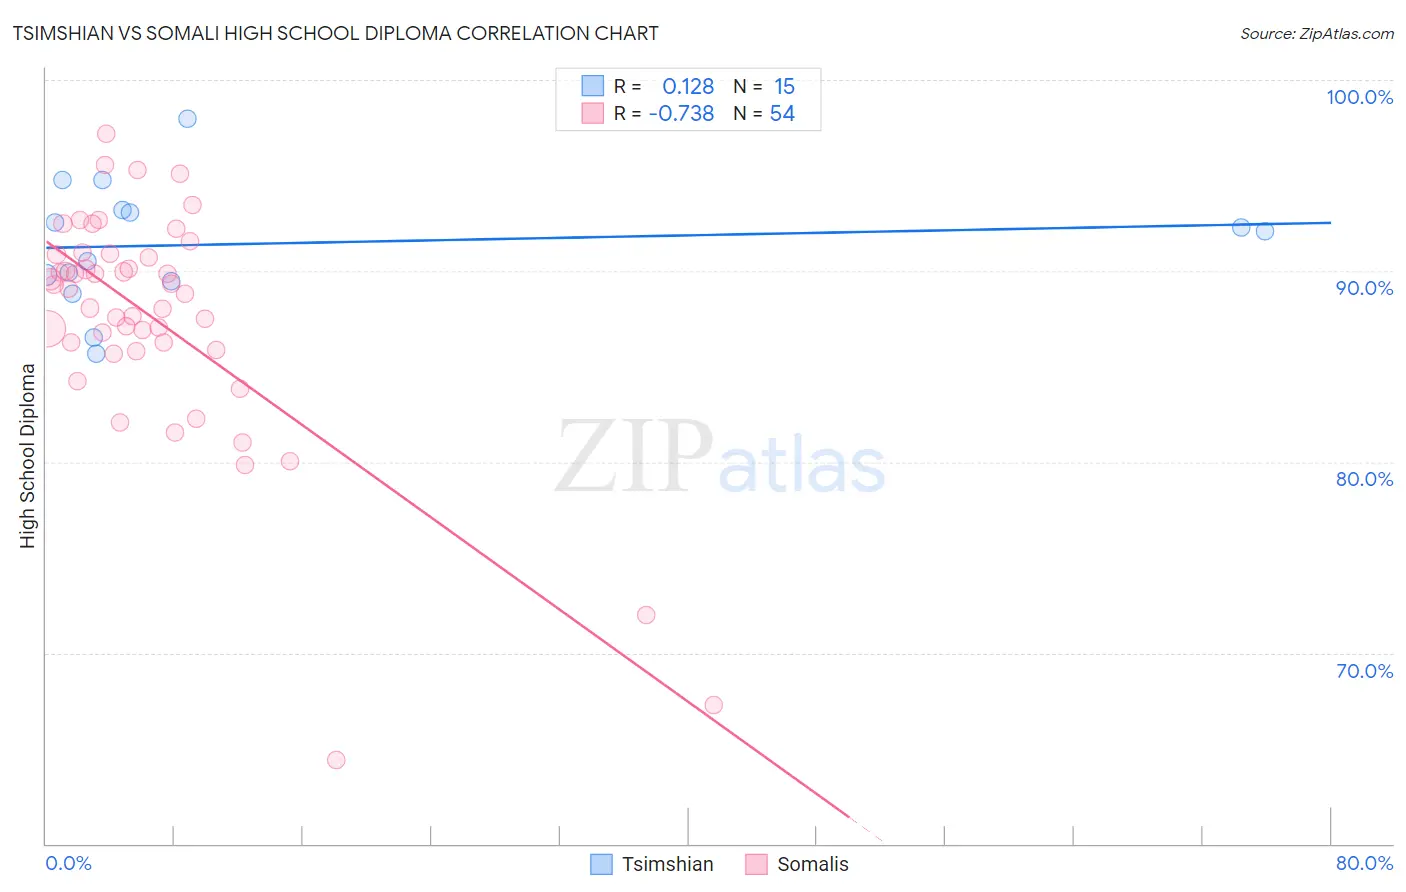
Tsimshian vs Somali High School Diploma Correlation Chart
The statistical analysis conducted on geographies consisting of 15,626,544 people shows a poor positive correlation between the proportion of Tsimshian and percentage of population with at least high school diploma education in the United States with a correlation coefficient (R) of 0.128 and weighted average of 91.3%. Similarly, the statistical analysis conducted on geographies consisting of 99,332,457 people shows a strong negative correlation between the proportion of Somalis and percentage of population with at least high school diploma education in the United States with a correlation coefficient (R) of -0.738 and weighted average of 88.6%, a difference of 3.1%.
High School Diploma Correlation Summary
| Measurement | Tsimshian | Somali |
| Minimum | 85.7% | 64.4% |
| Maximum | 98.0% | 97.2% |
| Range | 12.3% | 32.8% |
| Mean | 91.4% | 87.4% |
| Median | 92.1% | 88.9% |
| Interquartile 25% (IQ1) | 89.5% | 85.9% |
| Interquartile 75% (IQ3) | 93.2% | 90.9% |
| Interquartile Range (IQR) | 3.8% | 5.0% |
| Standard Deviation (Sample) | 3.2% | 6.2% |
| Standard Deviation (Population) | 3.1% | 6.1% |
Similar Demographics by High School Diploma
Demographics Similar to Tsimshian by High School Diploma
In terms of high school diploma, the demographic groups most similar to Tsimshian are Immigrants from Ireland (91.3%, a difference of 0.020%), Irish (91.4%, a difference of 0.030%), Immigrants from Scotland (91.3%, a difference of 0.040%), Dutch (91.3%, a difference of 0.050%), and Okinawan (91.4%, a difference of 0.060%).
| Demographics | Rating | Rank | High School Diploma |
| Europeans | 99.9 /100 | #29 | Exceptional 91.4% |
| Iranians | 99.9 /100 | #30 | Exceptional 91.4% |
| Immigrants | Northern Europe | 99.9 /100 | #31 | Exceptional 91.4% |
| English | 99.9 /100 | #32 | Exceptional 91.4% |
| Okinawans | 99.9 /100 | #33 | Exceptional 91.4% |
| Scottish | 99.9 /100 | #34 | Exceptional 91.4% |
| Irish | 99.9 /100 | #35 | Exceptional 91.4% |
| Tsimshian | 99.9 /100 | #36 | Exceptional 91.3% |
| Immigrants | Ireland | 99.9 /100 | #37 | Exceptional 91.3% |
| Immigrants | Scotland | 99.8 /100 | #38 | Exceptional 91.3% |
| Dutch | 99.8 /100 | #39 | Exceptional 91.3% |
| Immigrants | Lithuania | 99.8 /100 | #40 | Exceptional 91.3% |
| Immigrants | Australia | 99.8 /100 | #41 | Exceptional 91.3% |
| Northern Europeans | 99.8 /100 | #42 | Exceptional 91.3% |
| British | 99.8 /100 | #43 | Exceptional 91.3% |
Demographics Similar to Somalis by High School Diploma
In terms of high school diploma, the demographic groups most similar to Somalis are Panamanian (88.6%, a difference of 0.010%), Armenian (88.6%, a difference of 0.010%), Hawaiian (88.6%, a difference of 0.020%), Korean (88.6%, a difference of 0.020%), and Liberian (88.7%, a difference of 0.030%).
| Demographics | Rating | Rank | High School Diploma |
| Immigrants | Southern Europe | 23.4 /100 | #196 | Fair 88.7% |
| French American Indians | 21.5 /100 | #197 | Fair 88.7% |
| Liberians | 18.8 /100 | #198 | Poor 88.7% |
| Marshallese | 18.7 /100 | #199 | Poor 88.6% |
| Hawaiians | 18.3 /100 | #200 | Poor 88.6% |
| Koreans | 18.1 /100 | #201 | Poor 88.6% |
| Panamanians | 18.0 /100 | #202 | Poor 88.6% |
| Somalis | 17.5 /100 | #203 | Poor 88.6% |
| Armenians | 17.2 /100 | #204 | Poor 88.6% |
| Immigrants | Micronesia | 16.4 /100 | #205 | Poor 88.6% |
| Arapaho | 16.1 /100 | #206 | Poor 88.6% |
| Immigrants | Sierra Leone | 15.8 /100 | #207 | Poor 88.6% |
| Portuguese | 14.4 /100 | #208 | Poor 88.5% |
| Cherokee | 14.3 /100 | #209 | Poor 88.5% |
| Samoans | 14.0 /100 | #210 | Poor 88.5% |