Tsimshian vs Ghanaian Poverty
COMPARE
Tsimshian
Ghanaian
Poverty
Poverty Comparison
Tsimshian
Ghanaians
13.0%
POVERTY
9.2/ 100
METRIC RATING
205th/ 347
METRIC RANK
13.9%
POVERTY
0.5/ 100
METRIC RATING
238th/ 347
METRIC RANK
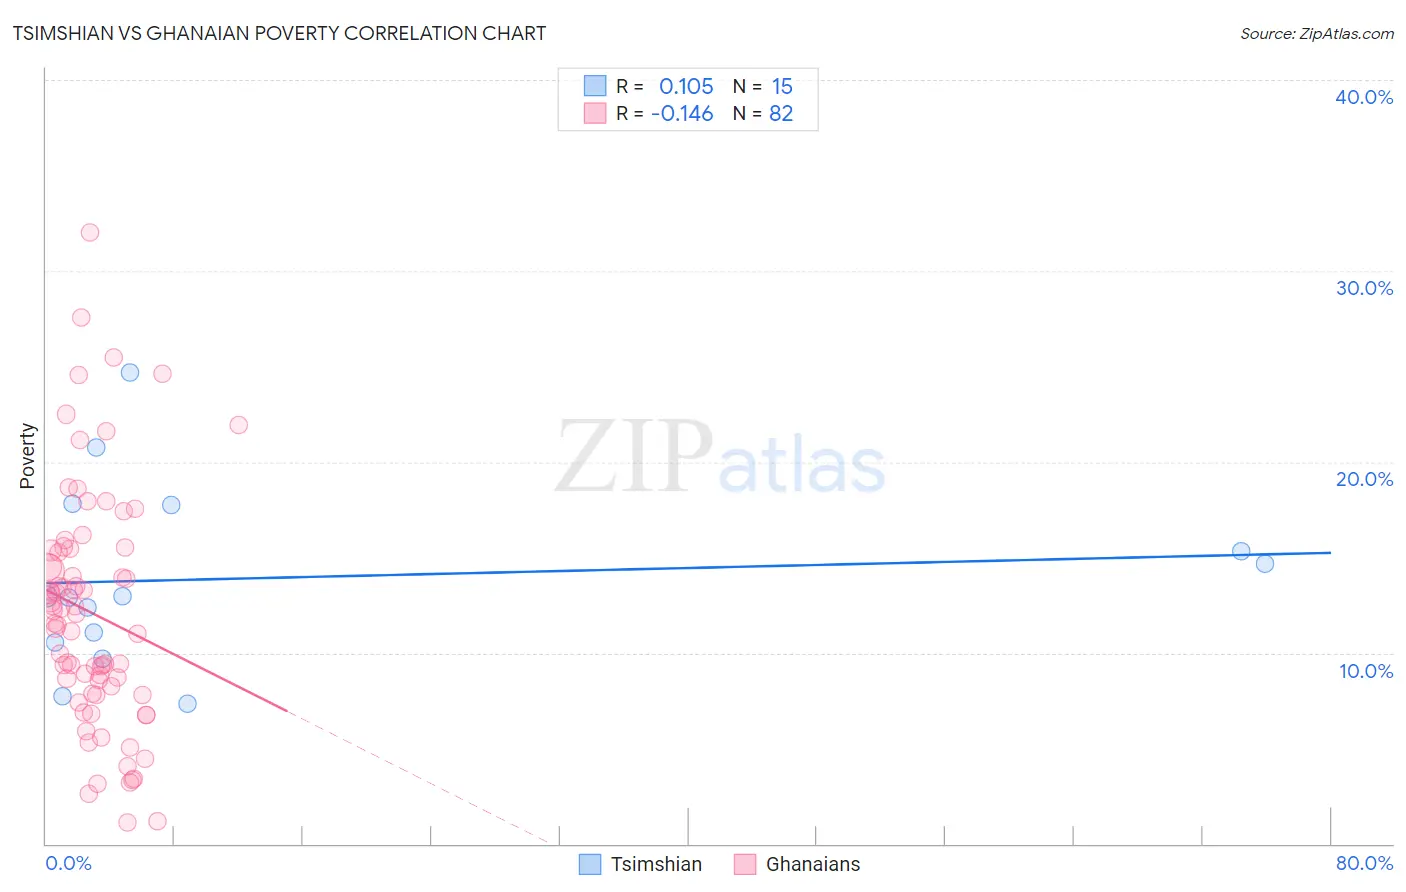
Tsimshian vs Ghanaian Poverty Correlation Chart
The statistical analysis conducted on geographies consisting of 15,626,462 people shows a poor positive correlation between the proportion of Tsimshian and poverty level in the United States with a correlation coefficient (R) of 0.105 and weighted average of 13.0%. Similarly, the statistical analysis conducted on geographies consisting of 190,556,077 people shows a poor negative correlation between the proportion of Ghanaians and poverty level in the United States with a correlation coefficient (R) of -0.146 and weighted average of 13.9%, a difference of 6.9%.
Poverty Correlation Summary
| Measurement | Tsimshian | Ghanaian |
| Minimum | 7.3% | 1.1% |
| Maximum | 24.7% | 32.0% |
| Range | 17.4% | 30.9% |
| Mean | 13.9% | 12.1% |
| Median | 12.9% | 11.8% |
| Interquartile 25% (IQ1) | 10.5% | 7.9% |
| Interquartile 75% (IQ3) | 17.7% | 15.4% |
| Interquartile Range (IQR) | 7.2% | 7.5% |
| Standard Deviation (Sample) | 4.8% | 6.2% |
| Standard Deviation (Population) | 4.6% | 6.2% |
Similar Demographics by Poverty
Demographics Similar to Tsimshian by Poverty
In terms of poverty, the demographic groups most similar to Tsimshian are Immigrants from Eastern Africa (13.1%, a difference of 0.70%), Panamanian (13.1%, a difference of 0.82%), Ugandan (13.1%, a difference of 0.98%), Malaysian (13.1%, a difference of 1.0%), and Immigrants from the Azores (13.1%, a difference of 1.0%).
| Demographics | Rating | Rank | Poverty |
| Spanish | 18.7 /100 | #198 | Poor 12.8% |
| Immigrants | Kenya | 17.5 /100 | #199 | Poor 12.8% |
| Spaniards | 16.5 /100 | #200 | Poor 12.8% |
| Immigrants | Uganda | 16.5 /100 | #201 | Poor 12.8% |
| Immigrants | Uruguay | 15.6 /100 | #202 | Poor 12.8% |
| Hmong | 15.0 /100 | #203 | Poor 12.8% |
| Immigrants | Western Asia | 14.1 /100 | #204 | Poor 12.9% |
| Tsimshian | 9.2 /100 | #205 | Tragic 13.0% |
| Immigrants | Eastern Africa | 7.0 /100 | #206 | Tragic 13.1% |
| Panamanians | 6.6 /100 | #207 | Tragic 13.1% |
| Ugandans | 6.2 /100 | #208 | Tragic 13.1% |
| Malaysians | 6.1 /100 | #209 | Tragic 13.1% |
| Immigrants | Azores | 6.1 /100 | #210 | Tragic 13.1% |
| Moroccans | 5.2 /100 | #211 | Tragic 13.2% |
| Immigrants | Immigrants | 4.3 /100 | #212 | Tragic 13.2% |
Demographics Similar to Ghanaians by Poverty
In terms of poverty, the demographic groups most similar to Ghanaians are French American Indian (13.9%, a difference of 0.13%), Immigrants from Armenia (13.9%, a difference of 0.15%), Cuban (13.9%, a difference of 0.19%), Nicaraguan (13.9%, a difference of 0.35%), and Immigrants from Middle Africa (14.0%, a difference of 0.47%).
| Demographics | Rating | Rank | Poverty |
| Nigerians | 1.4 /100 | #231 | Tragic 13.6% |
| Fijians | 0.8 /100 | #232 | Tragic 13.7% |
| Immigrants | Saudi Arabia | 0.8 /100 | #233 | Tragic 13.8% |
| Immigrants | Laos | 0.7 /100 | #234 | Tragic 13.8% |
| Cubans | 0.6 /100 | #235 | Tragic 13.9% |
| Immigrants | Armenia | 0.5 /100 | #236 | Tragic 13.9% |
| French American Indians | 0.5 /100 | #237 | Tragic 13.9% |
| Ghanaians | 0.5 /100 | #238 | Tragic 13.9% |
| Nicaraguans | 0.4 /100 | #239 | Tragic 13.9% |
| Immigrants | Middle Africa | 0.4 /100 | #240 | Tragic 14.0% |
| Salvadorans | 0.4 /100 | #241 | Tragic 14.0% |
| Ecuadorians | 0.4 /100 | #242 | Tragic 14.0% |
| Sudanese | 0.3 /100 | #243 | Tragic 14.0% |
| Nepalese | 0.3 /100 | #244 | Tragic 14.0% |
| Immigrants | Sudan | 0.3 /100 | #245 | Tragic 14.1% |