Ottawa vs Immigrants from Korea Family Poverty
COMPARE
Ottawa
Immigrants from Korea
Family Poverty
Family Poverty Comparison
Ottawa
Immigrants from Korea
10.0%
FAMILY POVERTY
3.3/ 100
METRIC RATING
226th/ 347
METRIC RANK
7.4%
FAMILY POVERTY
99.6/ 100
METRIC RATING
28th/ 347
METRIC RANK
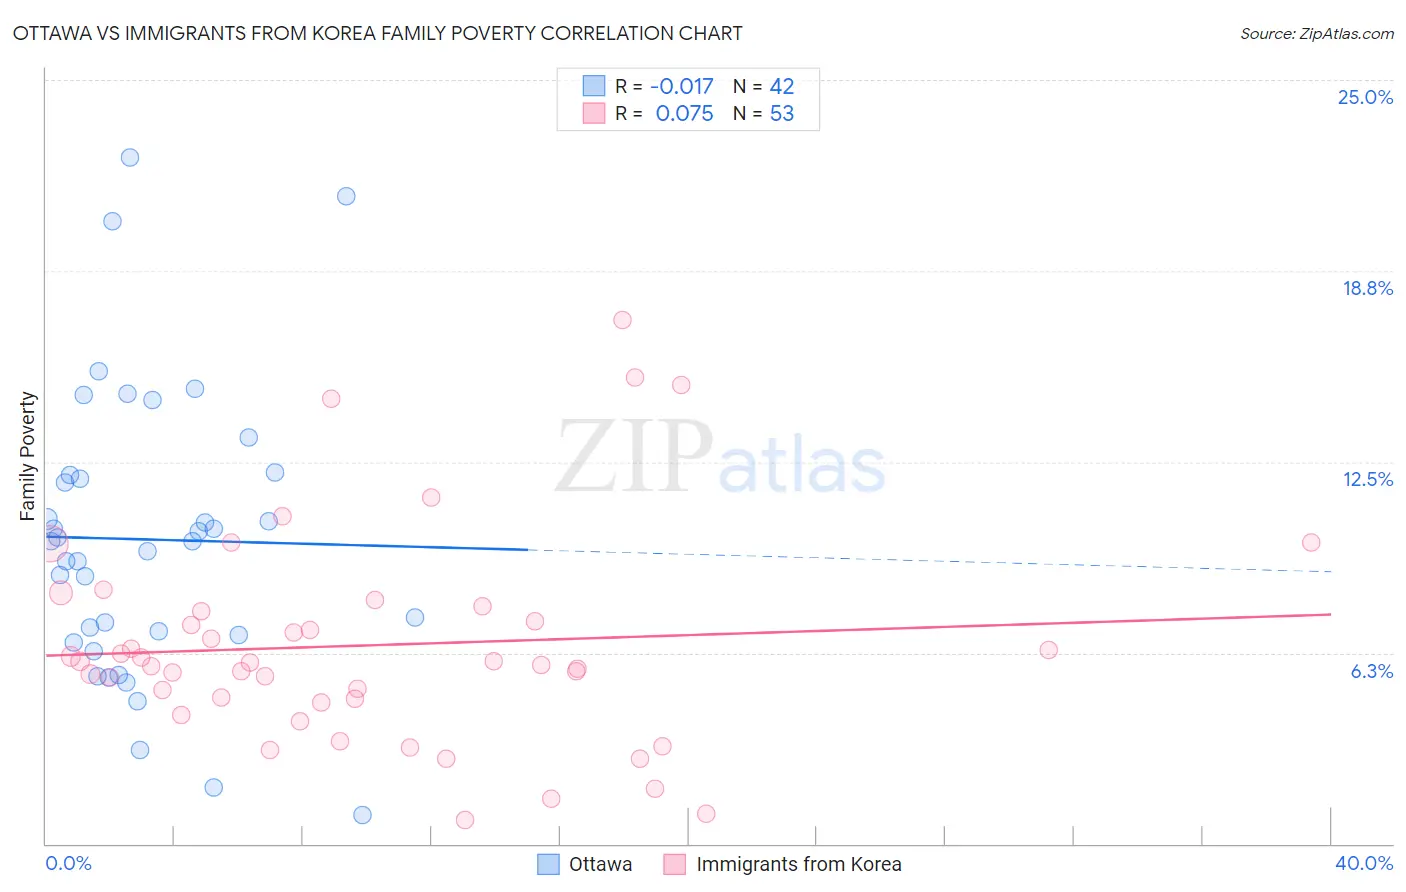
Ottawa vs Immigrants from Korea Family Poverty Correlation Chart
The statistical analysis conducted on geographies consisting of 49,932,404 people shows no correlation between the proportion of Ottawa and poverty level among families in the United States with a correlation coefficient (R) of -0.017 and weighted average of 10.0%. Similarly, the statistical analysis conducted on geographies consisting of 414,824,351 people shows a slight positive correlation between the proportion of Immigrants from Korea and poverty level among families in the United States with a correlation coefficient (R) of 0.075 and weighted average of 7.4%, a difference of 35.7%.
Family Poverty Correlation Summary
| Measurement | Ottawa | Immigrants from Korea |
| Minimum | 0.96% | 0.76% |
| Maximum | 22.5% | 17.2% |
| Range | 21.5% | 16.4% |
| Mean | 10.0% | 6.5% |
| Median | 9.9% | 5.9% |
| Interquartile 25% (IQ1) | 6.8% | 4.7% |
| Interquartile 75% (IQ3) | 12.1% | 7.7% |
| Interquartile Range (IQR) | 5.2% | 3.0% |
| Standard Deviation (Sample) | 4.7% | 3.5% |
| Standard Deviation (Population) | 4.7% | 3.5% |
Similar Demographics by Family Poverty
Demographics Similar to Ottawa by Family Poverty
In terms of family poverty, the demographic groups most similar to Ottawa are Immigrants from Armenia (10.0%, a difference of 0.020%), Sudanese (10.0%, a difference of 0.22%), Immigrants from Uzbekistan (10.0%, a difference of 0.23%), Immigrants from Panama (10.0%, a difference of 0.25%), and Immigrants (10.0%, a difference of 0.27%).
| Demographics | Rating | Rank | Family Poverty |
| Immigrants | Eritrea | 5.4 /100 | #219 | Tragic 9.9% |
| Bermudans | 5.3 /100 | #220 | Tragic 9.9% |
| Immigrants | Cambodia | 4.8 /100 | #221 | Tragic 9.9% |
| Japanese | 4.8 /100 | #222 | Tragic 9.9% |
| Immigrants | Africa | 4.3 /100 | #223 | Tragic 9.9% |
| Marshallese | 3.9 /100 | #224 | Tragic 9.9% |
| Immigrants | Immigrants | 3.6 /100 | #225 | Tragic 10.0% |
| Ottawa | 3.3 /100 | #226 | Tragic 10.0% |
| Immigrants | Armenia | 3.3 /100 | #227 | Tragic 10.0% |
| Sudanese | 3.1 /100 | #228 | Tragic 10.0% |
| Immigrants | Uzbekistan | 3.1 /100 | #229 | Tragic 10.0% |
| Immigrants | Panama | 3.1 /100 | #230 | Tragic 10.0% |
| Alaskan Athabascans | 2.7 /100 | #231 | Tragic 10.1% |
| Immigrants | Sudan | 2.3 /100 | #232 | Tragic 10.1% |
| Fijians | 2.1 /100 | #233 | Tragic 10.1% |
Demographics Similar to Immigrants from Korea by Family Poverty
In terms of family poverty, the demographic groups most similar to Immigrants from Korea are Immigrants from Northern Europe (7.4%, a difference of 0.17%), Immigrants from Scotland (7.3%, a difference of 0.39%), Cypriot (7.3%, a difference of 0.40%), Italian (7.4%, a difference of 0.46%), and Czech (7.4%, a difference of 0.58%).
| Demographics | Rating | Rank | Family Poverty |
| Immigrants | Iran | 99.7 /100 | #21 | Exceptional 7.3% |
| Danes | 99.7 /100 | #22 | Exceptional 7.3% |
| Assyrians/Chaldeans/Syriacs | 99.7 /100 | #23 | Exceptional 7.3% |
| Croatians | 99.7 /100 | #24 | Exceptional 7.3% |
| Burmese | 99.7 /100 | #25 | Exceptional 7.3% |
| Cypriots | 99.6 /100 | #26 | Exceptional 7.3% |
| Immigrants | Scotland | 99.6 /100 | #27 | Exceptional 7.3% |
| Immigrants | Korea | 99.6 /100 | #28 | Exceptional 7.4% |
| Immigrants | Northern Europe | 99.6 /100 | #29 | Exceptional 7.4% |
| Italians | 99.6 /100 | #30 | Exceptional 7.4% |
| Czechs | 99.6 /100 | #31 | Exceptional 7.4% |
| Poles | 99.5 /100 | #32 | Exceptional 7.4% |
| Immigrants | Japan | 99.5 /100 | #33 | Exceptional 7.4% |
| Russians | 99.5 /100 | #34 | Exceptional 7.5% |
| Greeks | 99.4 /100 | #35 | Exceptional 7.5% |