Immigrants from Israel vs Immigrants from Korea Family Poverty
COMPARE
Immigrants from Israel
Immigrants from Korea
Family Poverty
Family Poverty Comparison
Immigrants from Israel
Immigrants from Korea
8.2%
FAMILY POVERTY
93.5/ 100
METRIC RATING
115th/ 347
METRIC RANK
7.4%
FAMILY POVERTY
99.6/ 100
METRIC RATING
28th/ 347
METRIC RANK
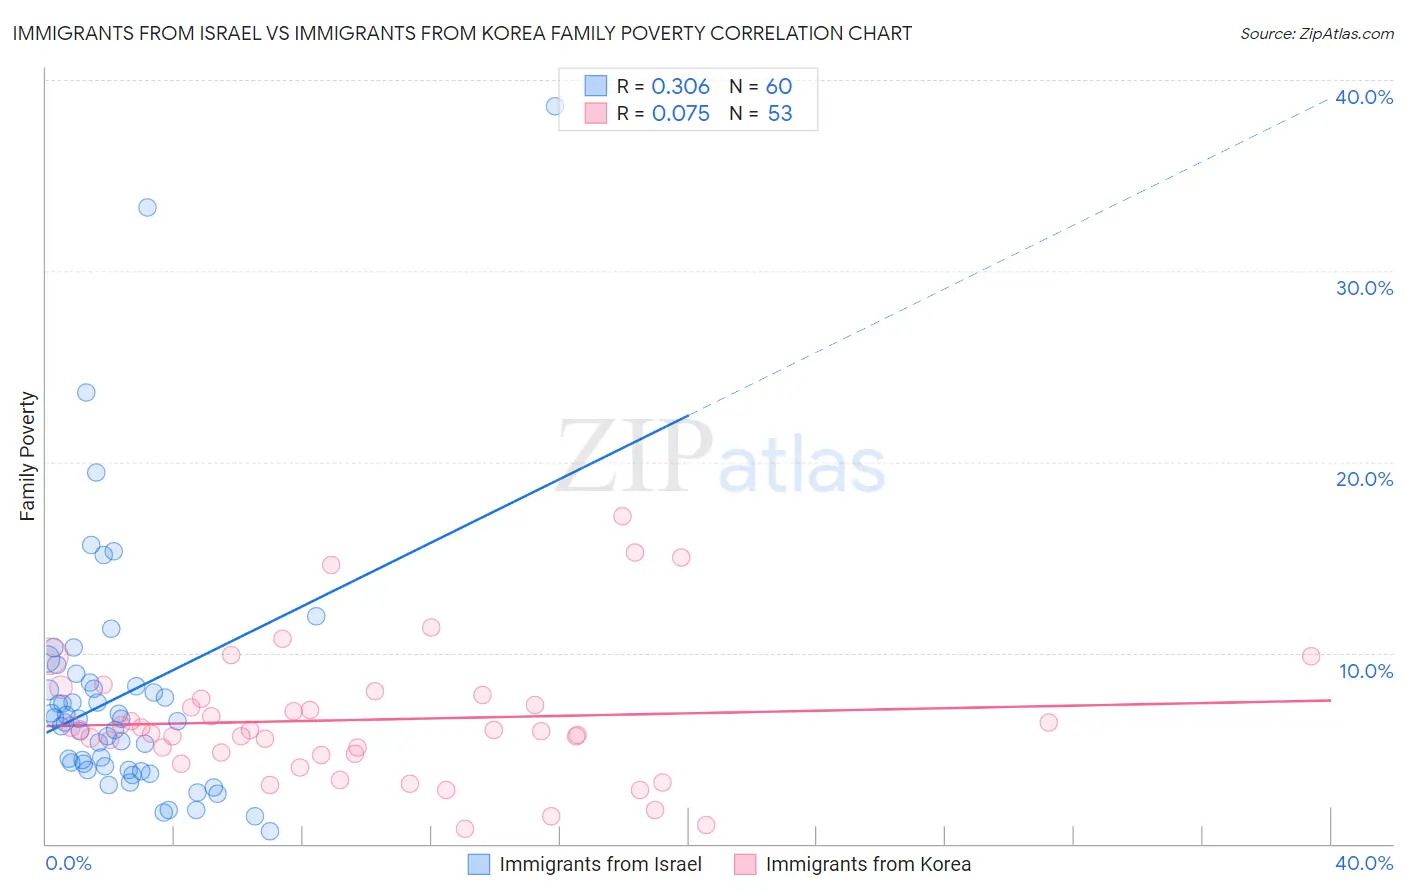
Immigrants from Israel vs Immigrants from Korea Family Poverty Correlation Chart
The statistical analysis conducted on geographies consisting of 209,738,348 people shows a mild positive correlation between the proportion of Immigrants from Israel and poverty level among families in the United States with a correlation coefficient (R) of 0.306 and weighted average of 8.2%. Similarly, the statistical analysis conducted on geographies consisting of 414,824,351 people shows a slight positive correlation between the proportion of Immigrants from Korea and poverty level among families in the United States with a correlation coefficient (R) of 0.075 and weighted average of 7.4%, a difference of 11.5%.
Family Poverty Correlation Summary
| Measurement | Immigrants from Israel | Immigrants from Korea |
| Minimum | 0.67% | 0.76% |
| Maximum | 38.6% | 17.2% |
| Range | 37.9% | 16.4% |
| Mean | 7.8% | 6.5% |
| Median | 6.5% | 5.9% |
| Interquartile 25% (IQ1) | 4.0% | 4.7% |
| Interquartile 75% (IQ3) | 8.3% | 7.7% |
| Interquartile Range (IQR) | 4.4% | 3.0% |
| Standard Deviation (Sample) | 6.8% | 3.5% |
| Standard Deviation (Population) | 6.7% | 3.5% |
Similar Demographics by Family Poverty
Demographics Similar to Immigrants from Israel by Family Poverty
In terms of family poverty, the demographic groups most similar to Immigrants from Israel are South African (8.2%, a difference of 0.060%), Immigrants from Russia (8.2%, a difference of 0.13%), Immigrants from Western Europe (8.2%, a difference of 0.32%), Immigrants from Zimbabwe (8.2%, a difference of 0.34%), and French (8.3%, a difference of 0.39%).
| Demographics | Rating | Rank | Family Poverty |
| Basques | 94.9 /100 | #108 | Exceptional 8.1% |
| Jordanians | 94.8 /100 | #109 | Exceptional 8.2% |
| Romanians | 94.7 /100 | #110 | Exceptional 8.2% |
| Taiwanese | 94.6 /100 | #111 | Exceptional 8.2% |
| Immigrants | France | 94.4 /100 | #112 | Exceptional 8.2% |
| Canadians | 94.2 /100 | #113 | Exceptional 8.2% |
| Immigrants | Zimbabwe | 94.0 /100 | #114 | Exceptional 8.2% |
| Immigrants | Israel | 93.5 /100 | #115 | Exceptional 8.2% |
| South Africans | 93.4 /100 | #116 | Exceptional 8.2% |
| Immigrants | Russia | 93.2 /100 | #117 | Exceptional 8.2% |
| Immigrants | Western Europe | 92.9 /100 | #118 | Exceptional 8.2% |
| French | 92.8 /100 | #119 | Exceptional 8.3% |
| Immigrants | Egypt | 91.6 /100 | #120 | Exceptional 8.3% |
| Native Hawaiians | 91.3 /100 | #121 | Exceptional 8.3% |
| Paraguayans | 91.2 /100 | #122 | Exceptional 8.3% |
Demographics Similar to Immigrants from Korea by Family Poverty
In terms of family poverty, the demographic groups most similar to Immigrants from Korea are Immigrants from Northern Europe (7.4%, a difference of 0.17%), Immigrants from Scotland (7.3%, a difference of 0.39%), Cypriot (7.3%, a difference of 0.40%), Italian (7.4%, a difference of 0.46%), and Czech (7.4%, a difference of 0.58%).
| Demographics | Rating | Rank | Family Poverty |
| Immigrants | Iran | 99.7 /100 | #21 | Exceptional 7.3% |
| Danes | 99.7 /100 | #22 | Exceptional 7.3% |
| Assyrians/Chaldeans/Syriacs | 99.7 /100 | #23 | Exceptional 7.3% |
| Croatians | 99.7 /100 | #24 | Exceptional 7.3% |
| Burmese | 99.7 /100 | #25 | Exceptional 7.3% |
| Cypriots | 99.6 /100 | #26 | Exceptional 7.3% |
| Immigrants | Scotland | 99.6 /100 | #27 | Exceptional 7.3% |
| Immigrants | Korea | 99.6 /100 | #28 | Exceptional 7.4% |
| Immigrants | Northern Europe | 99.6 /100 | #29 | Exceptional 7.4% |
| Italians | 99.6 /100 | #30 | Exceptional 7.4% |
| Czechs | 99.6 /100 | #31 | Exceptional 7.4% |
| Poles | 99.5 /100 | #32 | Exceptional 7.4% |
| Immigrants | Japan | 99.5 /100 | #33 | Exceptional 7.4% |
| Russians | 99.5 /100 | #34 | Exceptional 7.5% |
| Greeks | 99.4 /100 | #35 | Exceptional 7.5% |