Trinidadian and Tobagonian vs Puerto Rican 4th Grade
COMPARE
Trinidadian and Tobagonian
Puerto Rican
4th Grade
4th Grade Comparison
Trinidadians and Tobagonians
Puerto Ricans
96.9%
4TH GRADE
0.1/ 100
METRIC RATING
274th/ 347
METRIC RANK
96.7%
4TH GRADE
0.0/ 100
METRIC RATING
293rd/ 347
METRIC RANK
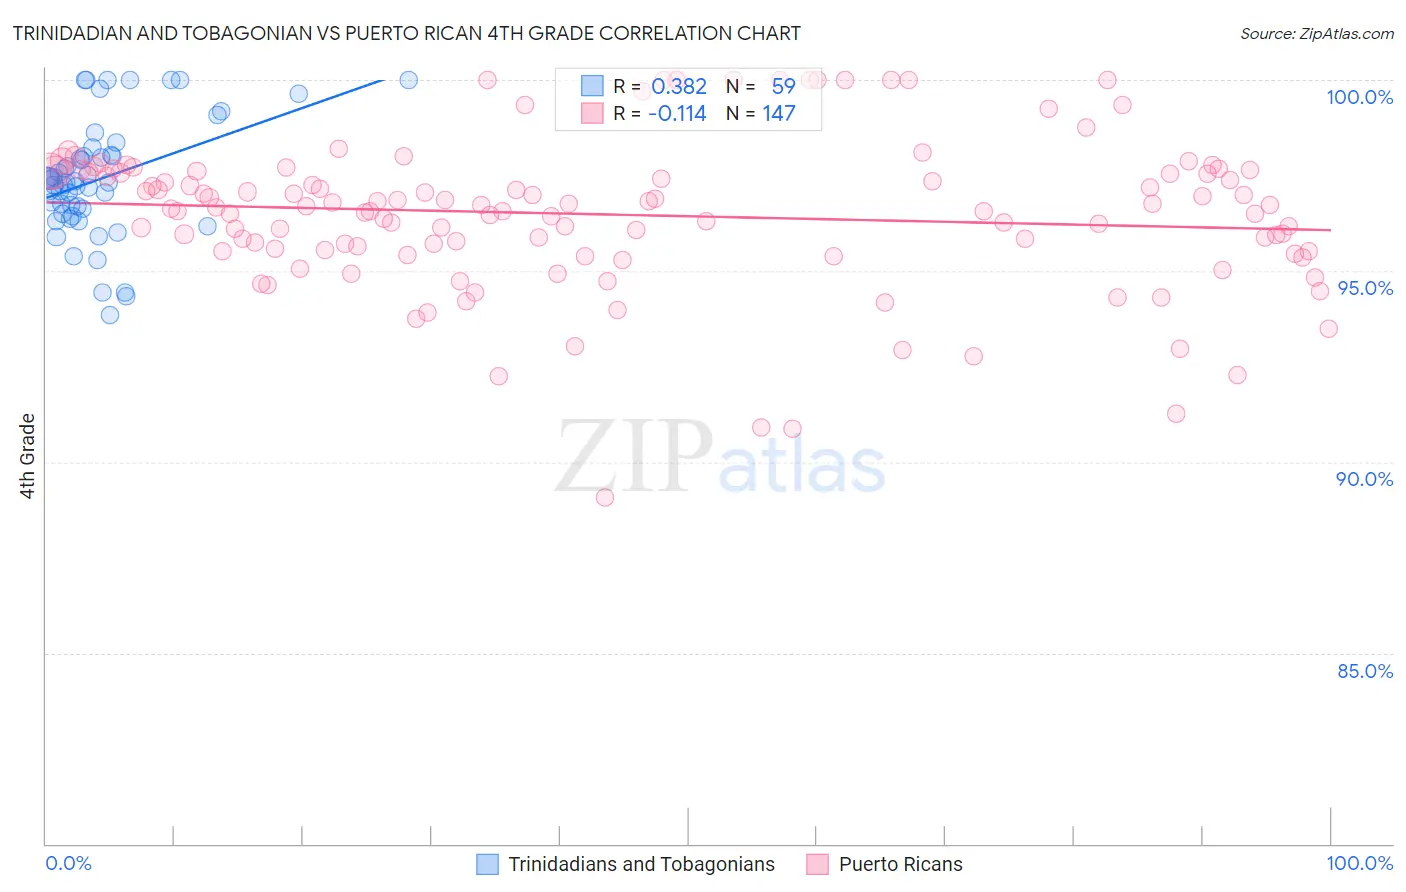
Trinidadian and Tobagonian vs Puerto Rican 4th Grade Correlation Chart
The statistical analysis conducted on geographies consisting of 219,882,819 people shows a mild positive correlation between the proportion of Trinidadians and Tobagonians and percentage of population with at least 4th grade education in the United States with a correlation coefficient (R) of 0.382 and weighted average of 96.9%. Similarly, the statistical analysis conducted on geographies consisting of 528,320,438 people shows a poor negative correlation between the proportion of Puerto Ricans and percentage of population with at least 4th grade education in the United States with a correlation coefficient (R) of -0.114 and weighted average of 96.7%, a difference of 0.22%.
4th Grade Correlation Summary
| Measurement | Trinidadian and Tobagonian | Puerto Rican |
| Minimum | 93.8% | 89.1% |
| Maximum | 100.0% | 100.0% |
| Range | 6.2% | 10.9% |
| Mean | 97.4% | 96.5% |
| Median | 97.3% | 96.7% |
| Interquartile 25% (IQ1) | 96.5% | 95.5% |
| Interquartile 75% (IQ3) | 98.0% | 97.6% |
| Interquartile Range (IQR) | 1.5% | 2.1% |
| Standard Deviation (Sample) | 1.5% | 2.0% |
| Standard Deviation (Population) | 1.5% | 2.0% |
Demographics Similar to Trinidadians and Tobagonians and Puerto Ricans by 4th Grade
In terms of 4th grade, the demographic groups most similar to Trinidadians and Tobagonians are Immigrants from Cameroon (96.9%, a difference of 0.010%), Immigrants from Ghana (96.9%, a difference of 0.010%), Yaqui (96.9%, a difference of 0.010%), Immigrants from Western Africa (96.9%, a difference of 0.010%), and Immigrants from Bolivia (96.9%, a difference of 0.020%). Similarly, the demographic groups most similar to Puerto Ricans are Malaysian (96.7%, a difference of 0.020%), Immigrants from Grenada (96.7%, a difference of 0.030%), British West Indian (96.7%, a difference of 0.050%), Immigrants from West Indies (96.7%, a difference of 0.070%), and Houma (96.8%, a difference of 0.090%).
| Demographics | Rating | Rank | 4th Grade |
| Immigrants | Cameroon | 0.1 /100 | #273 | Tragic 96.9% |
| Trinidadians and Tobagonians | 0.1 /100 | #274 | Tragic 96.9% |
| Immigrants | Ghana | 0.1 /100 | #275 | Tragic 96.9% |
| Yaqui | 0.1 /100 | #276 | Tragic 96.9% |
| Immigrants | Western Africa | 0.1 /100 | #277 | Tragic 96.9% |
| Immigrants | Bolivia | 0.1 /100 | #278 | Tragic 96.9% |
| Afghans | 0.1 /100 | #279 | Tragic 96.9% |
| Barbadians | 0.1 /100 | #280 | Tragic 96.9% |
| Immigrants | Hong Kong | 0.1 /100 | #281 | Tragic 96.9% |
| Immigrants | Trinidad and Tobago | 0.1 /100 | #282 | Tragic 96.8% |
| Immigrants | Philippines | 0.1 /100 | #283 | Tragic 96.8% |
| Immigrants | St. Vincent and the Grenadines | 0.1 /100 | #284 | Tragic 96.8% |
| Immigrants | Barbados | 0.0 /100 | #285 | Tragic 96.8% |
| Immigrants | Thailand | 0.0 /100 | #286 | Tragic 96.8% |
| Houma | 0.0 /100 | #287 | Tragic 96.8% |
| Immigrants | Afghanistan | 0.0 /100 | #288 | Tragic 96.8% |
| Immigrants | West Indies | 0.0 /100 | #289 | Tragic 96.7% |
| British West Indians | 0.0 /100 | #290 | Tragic 96.7% |
| Immigrants | Grenada | 0.0 /100 | #291 | Tragic 96.7% |
| Malaysians | 0.0 /100 | #292 | Tragic 96.7% |
| Puerto Ricans | 0.0 /100 | #293 | Tragic 96.7% |