Trinidadian and Tobagonian vs Lithuanian Single Father Poverty
COMPARE
Trinidadian and Tobagonian
Lithuanian
Single Father Poverty
Single Father Poverty Comparison
Trinidadians and Tobagonians
Lithuanians
17.0%
SINGLE FATHER POVERTY
1.5/ 100
METRIC RATING
245th/ 347
METRIC RANK
17.3%
SINGLE FATHER POVERTY
0.4/ 100
METRIC RATING
263rd/ 347
METRIC RANK
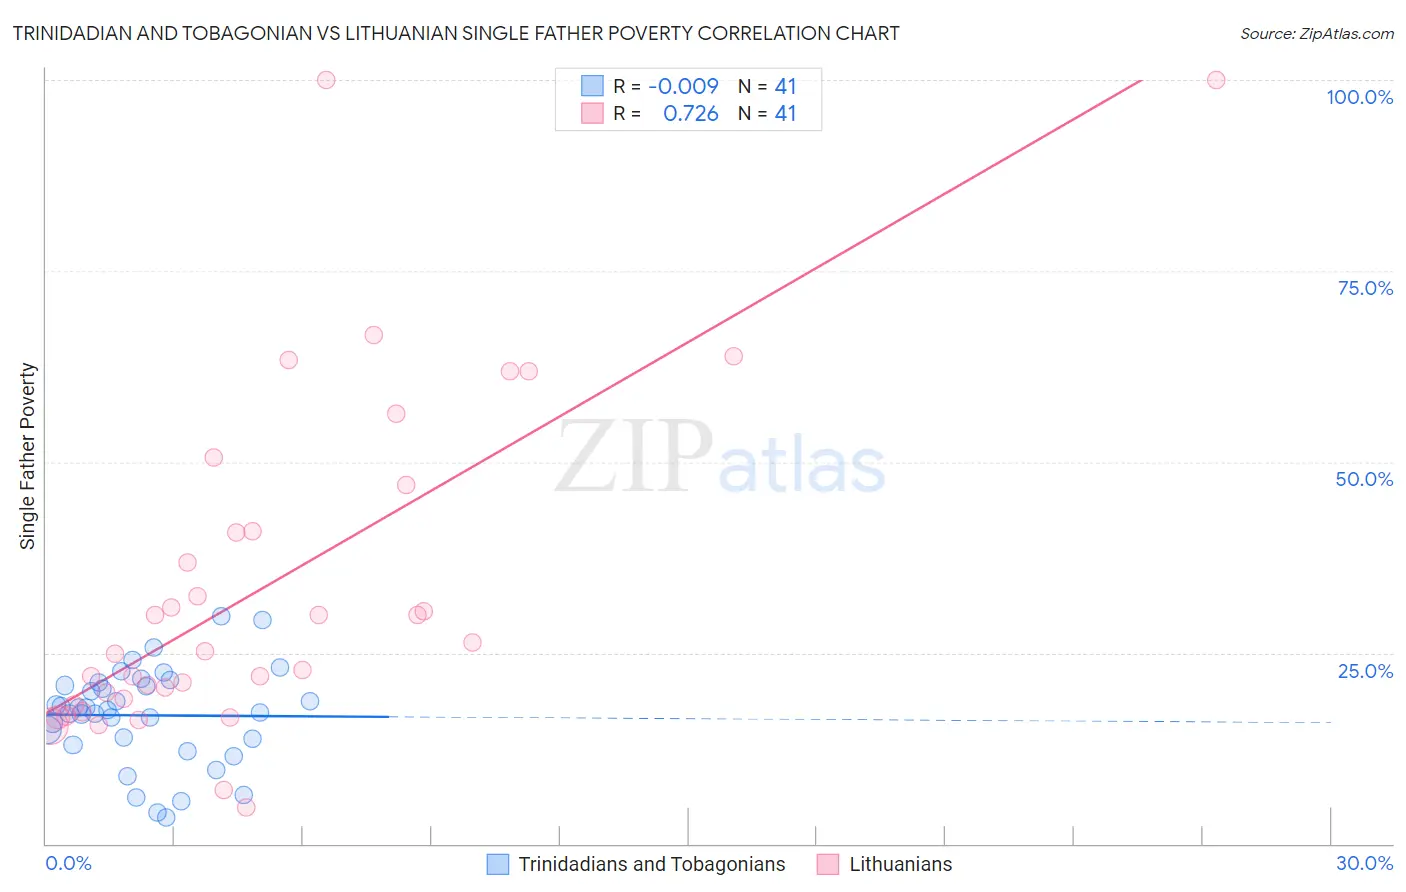
Trinidadian and Tobagonian vs Lithuanian Single Father Poverty Correlation Chart
The statistical analysis conducted on geographies consisting of 188,831,779 people shows no correlation between the proportion of Trinidadians and Tobagonians and poverty level among single fathers in the United States with a correlation coefficient (R) of -0.009 and weighted average of 17.0%. Similarly, the statistical analysis conducted on geographies consisting of 319,660,804 people shows a strong positive correlation between the proportion of Lithuanians and poverty level among single fathers in the United States with a correlation coefficient (R) of 0.726 and weighted average of 17.3%, a difference of 1.4%.
Single Father Poverty Correlation Summary
| Measurement | Trinidadian and Tobagonian | Lithuanian |
| Minimum | 3.5% | 4.8% |
| Maximum | 29.7% | 100.0% |
| Range | 26.2% | 95.2% |
| Mean | 16.8% | 33.8% |
| Median | 17.5% | 25.2% |
| Interquartile 25% (IQ1) | 13.4% | 18.5% |
| Interquartile 75% (IQ3) | 20.9% | 44.0% |
| Interquartile Range (IQR) | 7.6% | 25.5% |
| Standard Deviation (Sample) | 6.3% | 22.3% |
| Standard Deviation (Population) | 6.2% | 22.1% |
Demographics Similar to Trinidadians and Tobagonians and Lithuanians by Single Father Poverty
In terms of single father poverty, the demographic groups most similar to Trinidadians and Tobagonians are Honduran (17.0%, a difference of 0.040%), Immigrants from Ireland (17.1%, a difference of 0.040%), Greek (17.1%, a difference of 0.14%), Czechoslovakian (17.1%, a difference of 0.14%), and Canadian (17.1%, a difference of 0.19%). Similarly, the demographic groups most similar to Lithuanians are Immigrants from Zaire (17.3%, a difference of 0.010%), Swiss (17.3%, a difference of 0.14%), Slovene (17.3%, a difference of 0.20%), Spaniard (17.2%, a difference of 0.36%), and Immigrants from Jamaica (17.2%, a difference of 0.51%).
| Demographics | Rating | Rank | Single Father Poverty |
| Hondurans | 1.6 /100 | #244 | Tragic 17.0% |
| Trinidadians and Tobagonians | 1.5 /100 | #245 | Tragic 17.0% |
| Immigrants | Ireland | 1.4 /100 | #246 | Tragic 17.1% |
| Greeks | 1.3 /100 | #247 | Tragic 17.1% |
| Czechoslovakians | 1.3 /100 | #248 | Tragic 17.1% |
| Canadians | 1.3 /100 | #249 | Tragic 17.1% |
| Austrians | 1.1 /100 | #250 | Tragic 17.1% |
| Luxembourgers | 1.1 /100 | #251 | Tragic 17.1% |
| Croatians | 1.0 /100 | #252 | Tragic 17.1% |
| Cree | 1.0 /100 | #253 | Tragic 17.1% |
| Immigrants | Honduras | 0.9 /100 | #254 | Tragic 17.1% |
| Sierra Leoneans | 0.8 /100 | #255 | Tragic 17.2% |
| Immigrants | Haiti | 0.8 /100 | #256 | Tragic 17.2% |
| Immigrants | Albania | 0.7 /100 | #257 | Tragic 17.2% |
| Albanians | 0.7 /100 | #258 | Tragic 17.2% |
| Immigrants | Jamaica | 0.7 /100 | #259 | Tragic 17.2% |
| Spaniards | 0.6 /100 | #260 | Tragic 17.2% |
| Swiss | 0.5 /100 | #261 | Tragic 17.3% |
| Immigrants | Zaire | 0.4 /100 | #262 | Tragic 17.3% |
| Lithuanians | 0.4 /100 | #263 | Tragic 17.3% |
| Slovenes | 0.3 /100 | #264 | Tragic 17.3% |