Trinidadian and Tobagonian vs Immigrants from Jamaica Single Father Poverty
COMPARE
Trinidadian and Tobagonian
Immigrants from Jamaica
Single Father Poverty
Single Father Poverty Comparison
Trinidadians and Tobagonians
Immigrants from Jamaica
17.0%
SINGLE FATHER POVERTY
1.5/ 100
METRIC RATING
245th/ 347
METRIC RANK
17.2%
SINGLE FATHER POVERTY
0.7/ 100
METRIC RATING
259th/ 347
METRIC RANK
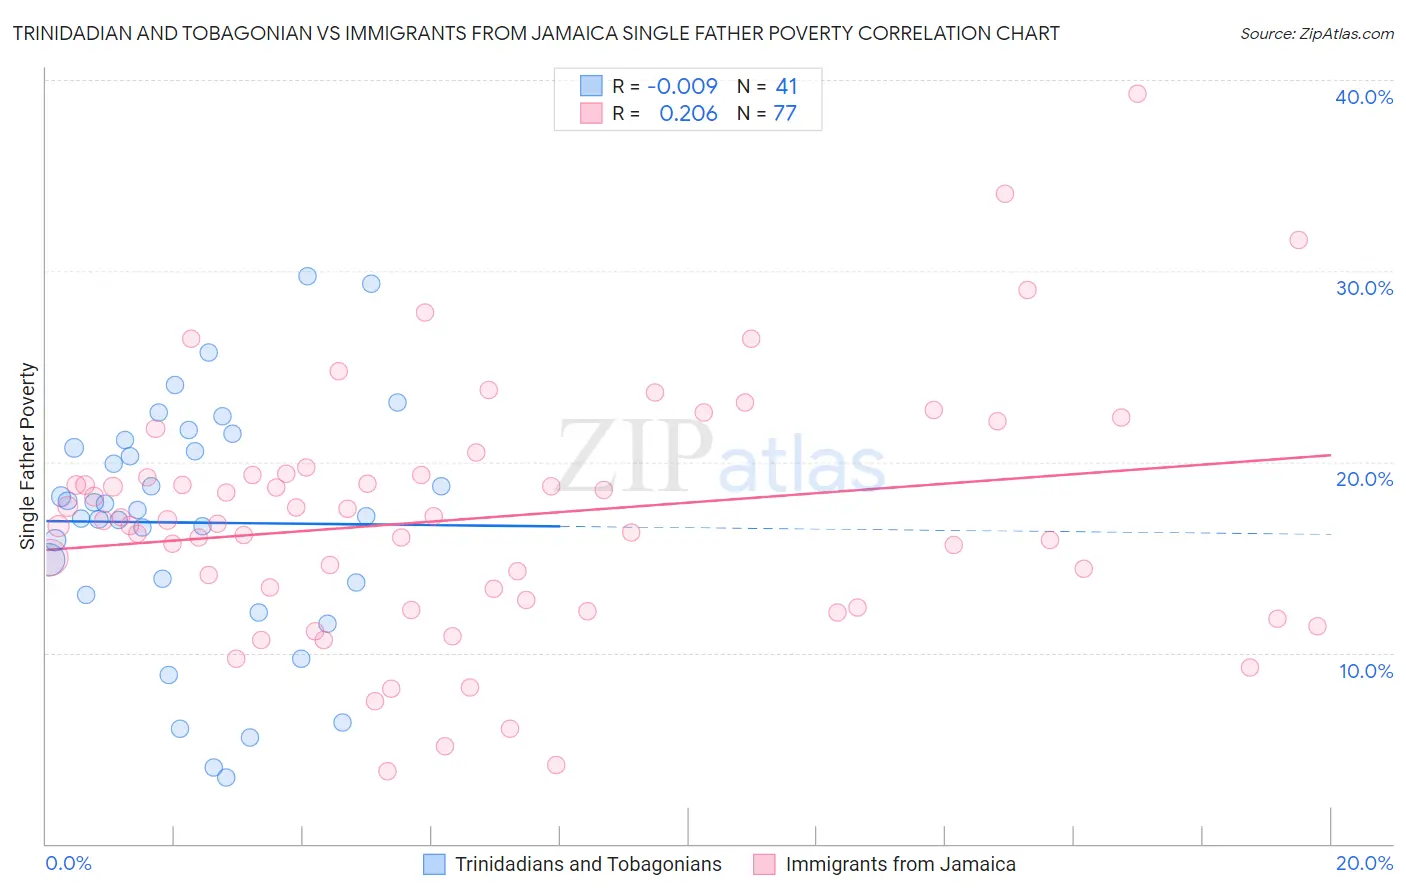
Trinidadian and Tobagonian vs Immigrants from Jamaica Single Father Poverty Correlation Chart
The statistical analysis conducted on geographies consisting of 188,831,779 people shows no correlation between the proportion of Trinidadians and Tobagonians and poverty level among single fathers in the United States with a correlation coefficient (R) of -0.009 and weighted average of 17.0%. Similarly, the statistical analysis conducted on geographies consisting of 246,936,090 people shows a weak positive correlation between the proportion of Immigrants from Jamaica and poverty level among single fathers in the United States with a correlation coefficient (R) of 0.206 and weighted average of 17.2%, a difference of 0.87%.
Single Father Poverty Correlation Summary
| Measurement | Trinidadian and Tobagonian | Immigrants from Jamaica |
| Minimum | 3.5% | 3.8% |
| Maximum | 29.7% | 39.3% |
| Range | 26.2% | 35.5% |
| Mean | 16.8% | 17.1% |
| Median | 17.5% | 16.9% |
| Interquartile 25% (IQ1) | 13.4% | 12.6% |
| Interquartile 75% (IQ3) | 20.9% | 19.3% |
| Interquartile Range (IQR) | 7.6% | 6.8% |
| Standard Deviation (Sample) | 6.3% | 6.5% |
| Standard Deviation (Population) | 6.2% | 6.4% |
Demographics Similar to Trinidadians and Tobagonians and Immigrants from Jamaica by Single Father Poverty
In terms of single father poverty, the demographic groups most similar to Trinidadians and Tobagonians are Honduran (17.0%, a difference of 0.040%), Immigrants from Ireland (17.1%, a difference of 0.040%), Immigrants from Cabo Verde (17.0%, a difference of 0.060%), Greek (17.1%, a difference of 0.14%), and Czechoslovakian (17.1%, a difference of 0.14%). Similarly, the demographic groups most similar to Immigrants from Jamaica are Albanian (17.2%, a difference of 0.040%), Immigrants from Albania (17.2%, a difference of 0.050%), Immigrants from Haiti (17.2%, a difference of 0.13%), Sierra Leonean (17.2%, a difference of 0.14%), and Spaniard (17.2%, a difference of 0.15%).
| Demographics | Rating | Rank | Single Father Poverty |
| Moroccans | 2.1 /100 | #242 | Tragic 17.0% |
| Immigrants | Cabo Verde | 1.6 /100 | #243 | Tragic 17.0% |
| Hondurans | 1.6 /100 | #244 | Tragic 17.0% |
| Trinidadians and Tobagonians | 1.5 /100 | #245 | Tragic 17.0% |
| Immigrants | Ireland | 1.4 /100 | #246 | Tragic 17.1% |
| Greeks | 1.3 /100 | #247 | Tragic 17.1% |
| Czechoslovakians | 1.3 /100 | #248 | Tragic 17.1% |
| Canadians | 1.3 /100 | #249 | Tragic 17.1% |
| Austrians | 1.1 /100 | #250 | Tragic 17.1% |
| Luxembourgers | 1.1 /100 | #251 | Tragic 17.1% |
| Croatians | 1.0 /100 | #252 | Tragic 17.1% |
| Cree | 1.0 /100 | #253 | Tragic 17.1% |
| Immigrants | Honduras | 0.9 /100 | #254 | Tragic 17.1% |
| Sierra Leoneans | 0.8 /100 | #255 | Tragic 17.2% |
| Immigrants | Haiti | 0.8 /100 | #256 | Tragic 17.2% |
| Immigrants | Albania | 0.7 /100 | #257 | Tragic 17.2% |
| Albanians | 0.7 /100 | #258 | Tragic 17.2% |
| Immigrants | Jamaica | 0.7 /100 | #259 | Tragic 17.2% |
| Spaniards | 0.6 /100 | #260 | Tragic 17.2% |
| Swiss | 0.5 /100 | #261 | Tragic 17.3% |
| Immigrants | Zaire | 0.4 /100 | #262 | Tragic 17.3% |