Immigrants from Fiji vs Colville Single Mother Poverty
COMPARE
Immigrants from Fiji
Colville
Single Mother Poverty
Single Mother Poverty Comparison
Immigrants from Fiji
Colville
26.6%
SINGLE MOTHER POVERTY
99.9/ 100
METRIC RATING
38th/ 347
METRIC RANK
39.3%
SINGLE MOTHER POVERTY
0.0/ 100
METRIC RATING
341st/ 347
METRIC RANK
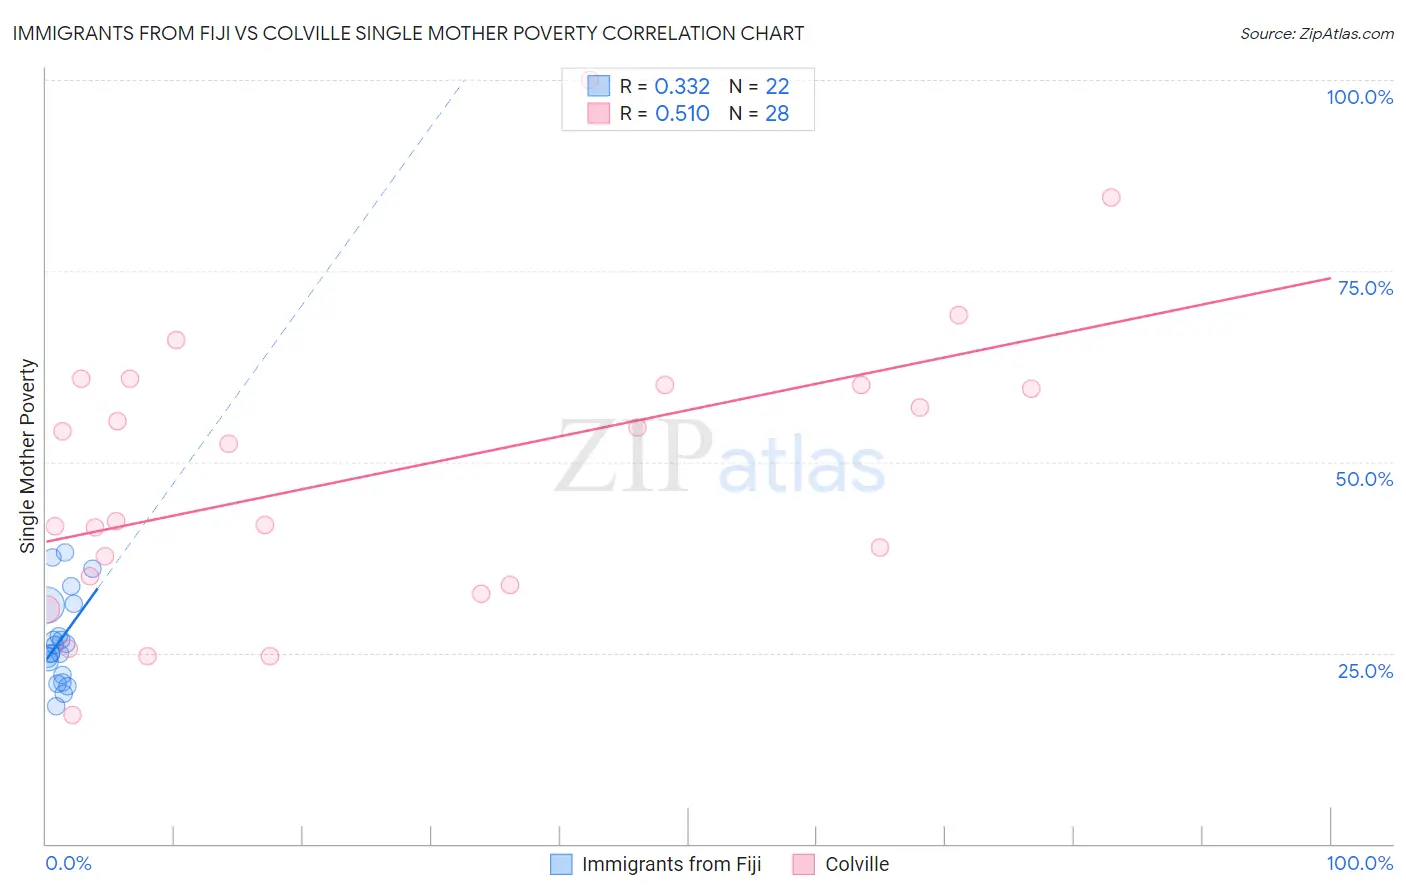
Immigrants from Fiji vs Colville Single Mother Poverty Correlation Chart
The statistical analysis conducted on geographies consisting of 93,178,948 people shows a mild positive correlation between the proportion of Immigrants from Fiji and poverty level among single mothers in the United States with a correlation coefficient (R) of 0.332 and weighted average of 26.6%. Similarly, the statistical analysis conducted on geographies consisting of 34,541,022 people shows a substantial positive correlation between the proportion of Colville and poverty level among single mothers in the United States with a correlation coefficient (R) of 0.510 and weighted average of 39.3%, a difference of 47.6%.
Single Mother Poverty Correlation Summary
| Measurement | Immigrants from Fiji | Colville |
| Minimum | 18.0% | 16.8% |
| Maximum | 38.1% | 100.0% |
| Range | 20.1% | 83.2% |
| Mean | 26.6% | 48.6% |
| Median | 25.5% | 47.3% |
| Interquartile 25% (IQ1) | 22.0% | 34.5% |
| Interquartile 75% (IQ3) | 31.2% | 60.0% |
| Interquartile Range (IQR) | 9.2% | 25.5% |
| Standard Deviation (Sample) | 5.8% | 18.9% |
| Standard Deviation (Population) | 5.6% | 18.5% |
Similar Demographics by Single Mother Poverty
Demographics Similar to Immigrants from Fiji by Single Mother Poverty
In terms of single mother poverty, the demographic groups most similar to Immigrants from Fiji are Okinawan (26.6%, a difference of 0.040%), Immigrants from Israel (26.6%, a difference of 0.040%), Maltese (26.6%, a difference of 0.090%), Immigrants from Indonesia (26.6%, a difference of 0.21%), and Bulgarian (26.5%, a difference of 0.22%).
| Demographics | Rating | Rank | Single Mother Poverty |
| Immigrants | Philippines | 100.0 /100 | #31 | Exceptional 26.5% |
| Tongans | 99.9 /100 | #32 | Exceptional 26.5% |
| Bulgarians | 99.9 /100 | #33 | Exceptional 26.5% |
| Immigrants | Indonesia | 99.9 /100 | #34 | Exceptional 26.6% |
| Maltese | 99.9 /100 | #35 | Exceptional 26.6% |
| Okinawans | 99.9 /100 | #36 | Exceptional 26.6% |
| Immigrants | Israel | 99.9 /100 | #37 | Exceptional 26.6% |
| Immigrants | Fiji | 99.9 /100 | #38 | Exceptional 26.6% |
| Sri Lankans | 99.9 /100 | #39 | Exceptional 26.7% |
| Immigrants | Vietnam | 99.9 /100 | #40 | Exceptional 26.7% |
| Immigrants | Greece | 99.9 /100 | #41 | Exceptional 26.7% |
| Armenians | 99.9 /100 | #42 | Exceptional 26.8% |
| Tsimshian | 99.9 /100 | #43 | Exceptional 26.8% |
| Immigrants | Sierra Leone | 99.9 /100 | #44 | Exceptional 26.9% |
| Latvians | 99.9 /100 | #45 | Exceptional 26.9% |
Demographics Similar to Colville by Single Mother Poverty
In terms of single mother poverty, the demographic groups most similar to Colville are Sioux (38.8%, a difference of 1.3%), Crow (38.6%, a difference of 1.7%), Pima (38.6%, a difference of 1.8%), Immigrants from Yemen (38.5%, a difference of 2.0%), and Cheyenne (38.5%, a difference of 2.1%).
| Demographics | Rating | Rank | Single Mother Poverty |
| Menominee | 0.0 /100 | #333 | Tragic 37.1% |
| Pueblo | 0.0 /100 | #334 | Tragic 37.2% |
| Yuman | 0.0 /100 | #335 | Tragic 37.8% |
| Cheyenne | 0.0 /100 | #336 | Tragic 38.5% |
| Immigrants | Yemen | 0.0 /100 | #337 | Tragic 38.5% |
| Pima | 0.0 /100 | #338 | Tragic 38.6% |
| Crow | 0.0 /100 | #339 | Tragic 38.6% |
| Sioux | 0.0 /100 | #340 | Tragic 38.8% |
| Colville | 0.0 /100 | #341 | Tragic 39.3% |
| Navajo | 0.0 /100 | #342 | Tragic 40.2% |
| Cajuns | 0.0 /100 | #343 | Tragic 40.3% |
| Tohono O'odham | 0.0 /100 | #344 | Tragic 43.0% |
| Lumbee | 0.0 /100 | #345 | Tragic 43.2% |
| Houma | 0.0 /100 | #346 | Tragic 43.5% |
| Puerto Ricans | 0.0 /100 | #347 | Tragic 44.5% |