Trinidadian and Tobagonian vs European Single Mother Poverty
COMPARE
Trinidadian and Tobagonian
European
Single Mother Poverty
Single Mother Poverty Comparison
Trinidadians and Tobagonians
Europeans
29.6%
SINGLE MOTHER POVERTY
21.7/ 100
METRIC RATING
198th/ 347
METRIC RANK
29.1%
SINGLE MOTHER POVERTY
57.6/ 100
METRIC RATING
168th/ 347
METRIC RANK
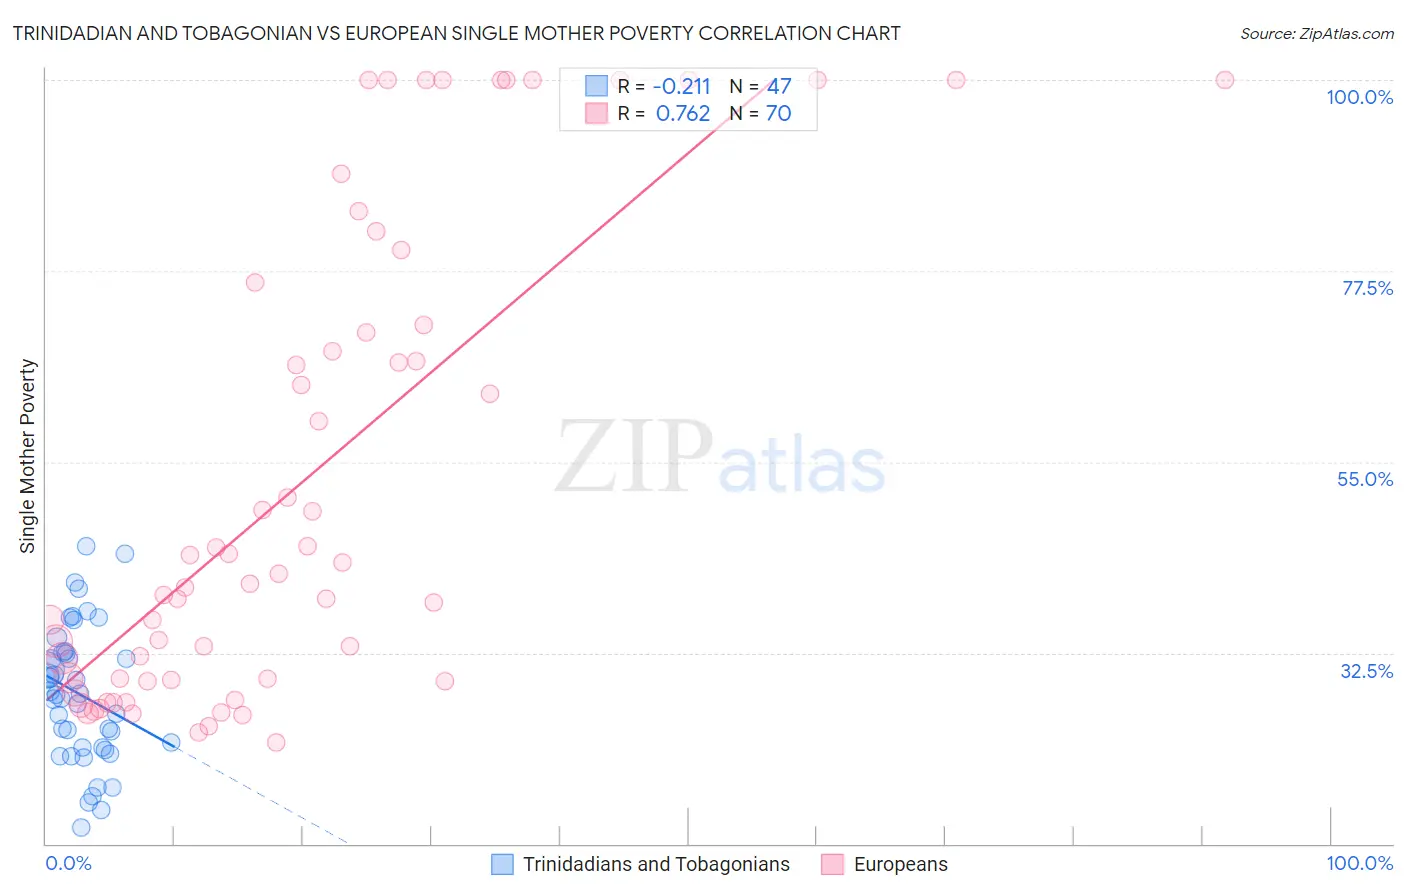
Trinidadian and Tobagonian vs European Single Mother Poverty Correlation Chart
The statistical analysis conducted on geographies consisting of 216,680,407 people shows a weak negative correlation between the proportion of Trinidadians and Tobagonians and poverty level among single mothers in the United States with a correlation coefficient (R) of -0.211 and weighted average of 29.6%. Similarly, the statistical analysis conducted on geographies consisting of 535,626,758 people shows a strong positive correlation between the proportion of Europeans and poverty level among single mothers in the United States with a correlation coefficient (R) of 0.762 and weighted average of 29.1%, a difference of 1.9%.
Single Mother Poverty Correlation Summary
| Measurement | Trinidadian and Tobagonian | European |
| Minimum | 12.0% | 22.0% |
| Maximum | 45.0% | 100.0% |
| Range | 33.0% | 78.0% |
| Mean | 27.6% | 52.7% |
| Median | 27.5% | 41.2% |
| Interquartile 25% (IQ1) | 21.4% | 29.3% |
| Interquartile 75% (IQ3) | 32.5% | 71.1% |
| Interquartile Range (IQR) | 11.1% | 41.7% |
| Standard Deviation (Sample) | 8.0% | 27.4% |
| Standard Deviation (Population) | 7.9% | 27.2% |
Similar Demographics by Single Mother Poverty
Demographics Similar to Trinidadians and Tobagonians by Single Mother Poverty
In terms of single mother poverty, the demographic groups most similar to Trinidadians and Tobagonians are Immigrants from Jamaica (29.6%, a difference of 0.020%), Cuban (29.6%, a difference of 0.070%), Spanish American Indian (29.6%, a difference of 0.11%), Panamanian (29.6%, a difference of 0.12%), and Slavic (29.6%, a difference of 0.18%).
| Demographics | Rating | Rank | Single Mother Poverty |
| Immigrants | Trinidad and Tobago | 29.2 /100 | #191 | Fair 29.5% |
| Moroccans | 28.6 /100 | #192 | Fair 29.5% |
| Basques | 28.3 /100 | #193 | Fair 29.5% |
| Icelanders | 26.1 /100 | #194 | Fair 29.5% |
| Slavs | 24.5 /100 | #195 | Fair 29.6% |
| Spanish American Indians | 23.4 /100 | #196 | Fair 29.6% |
| Immigrants | Jamaica | 22.0 /100 | #197 | Fair 29.6% |
| Trinidadians and Tobagonians | 21.7 /100 | #198 | Fair 29.6% |
| Cubans | 20.8 /100 | #199 | Fair 29.6% |
| Panamanians | 20.0 /100 | #200 | Fair 29.6% |
| Belgians | 18.8 /100 | #201 | Poor 29.7% |
| Malaysians | 17.4 /100 | #202 | Poor 29.7% |
| Swiss | 17.2 /100 | #203 | Poor 29.7% |
| Immigrants | Immigrants | 16.6 /100 | #204 | Poor 29.7% |
| Czechoslovakians | 16.1 /100 | #205 | Poor 29.7% |
Demographics Similar to Europeans by Single Mother Poverty
In terms of single mother poverty, the demographic groups most similar to Europeans are Immigrants from Uruguay (29.1%, a difference of 0.020%), Costa Rican (29.0%, a difference of 0.040%), New Zealander (29.1%, a difference of 0.12%), Puget Sound Salish (29.1%, a difference of 0.12%), and Inupiat (29.0%, a difference of 0.14%).
| Demographics | Rating | Rank | Single Mother Poverty |
| Immigrants | Cambodia | 66.6 /100 | #161 | Good 28.9% |
| Scandinavians | 66.2 /100 | #162 | Good 28.9% |
| Immigrants | Nigeria | 65.9 /100 | #163 | Good 28.9% |
| Immigrants | Kenya | 65.9 /100 | #164 | Good 28.9% |
| Arabs | 60.7 /100 | #165 | Good 29.0% |
| Inupiat | 60.4 /100 | #166 | Good 29.0% |
| Costa Ricans | 58.4 /100 | #167 | Average 29.0% |
| Europeans | 57.6 /100 | #168 | Average 29.1% |
| Immigrants | Uruguay | 57.2 /100 | #169 | Average 29.1% |
| New Zealanders | 55.1 /100 | #170 | Average 29.1% |
| Puget Sound Salish | 55.1 /100 | #171 | Average 29.1% |
| Carpatho Rusyns | 53.8 /100 | #172 | Average 29.1% |
| British | 50.6 /100 | #173 | Average 29.2% |
| Immigrants | Saudi Arabia | 50.0 /100 | #174 | Average 29.2% |
| Immigrants | Costa Rica | 48.8 /100 | #175 | Average 29.2% |