Trinidadian and Tobagonian vs Spaniard Child Poverty Under the Age of 5
COMPARE
Trinidadian and Tobagonian
Spaniard
Child Poverty Under the Age of 5
Child Poverty Under the Age of 5 Comparison
Trinidadians and Tobagonians
Spaniards
19.3%
CHILD POVERTY UNDER THE AGE OF 5
0.9/ 100
METRIC RATING
232nd/ 347
METRIC RANK
18.1%
CHILD POVERTY UNDER THE AGE OF 5
12.8/ 100
METRIC RATING
205th/ 347
METRIC RANK
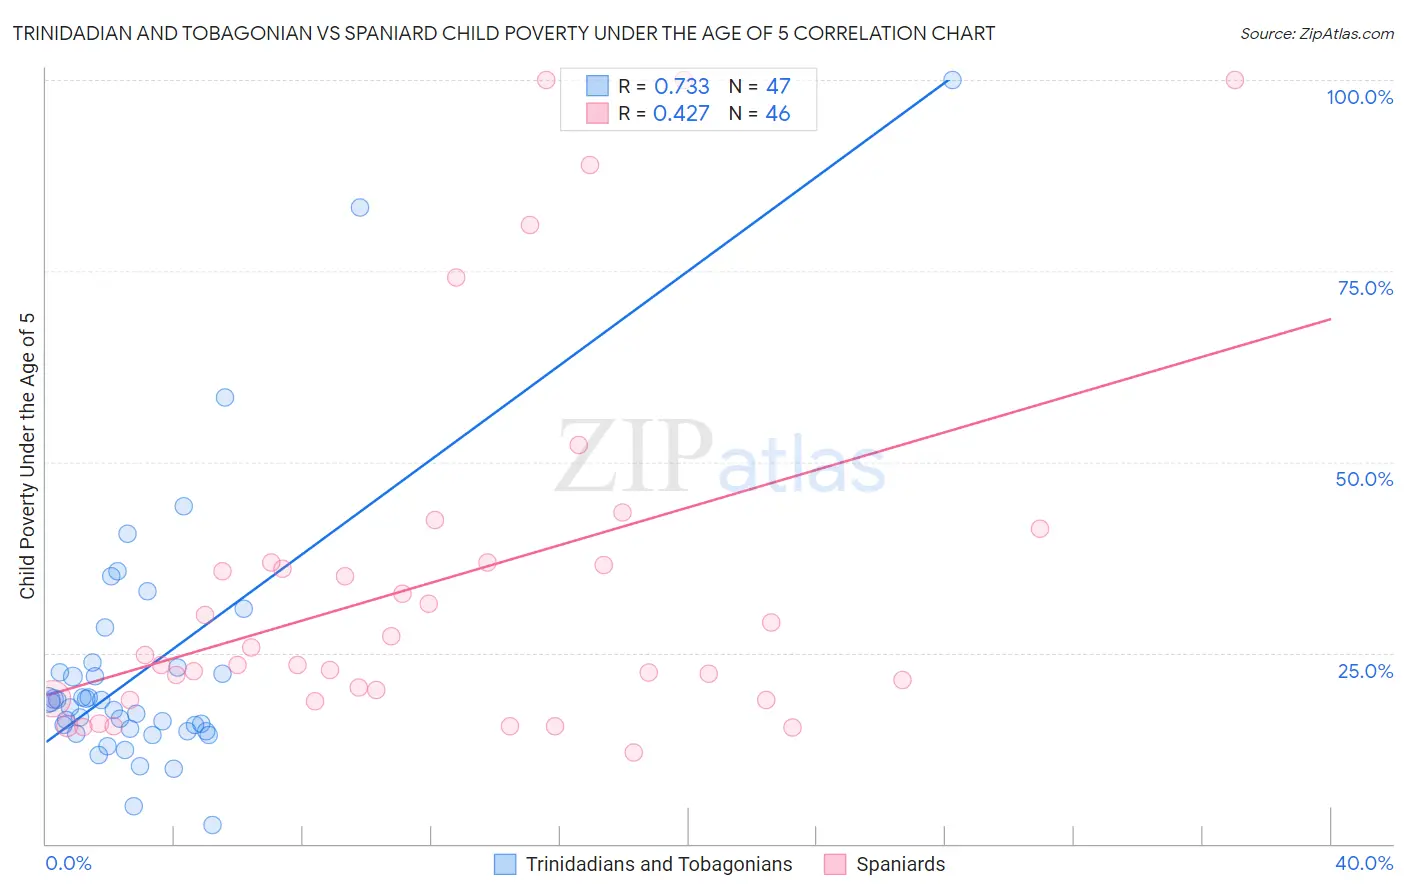
Trinidadian and Tobagonian vs Spaniard Child Poverty Under the Age of 5 Correlation Chart
The statistical analysis conducted on geographies consisting of 214,796,578 people shows a strong positive correlation between the proportion of Trinidadians and Tobagonians and poverty level among children under the age of 5 in the United States with a correlation coefficient (R) of 0.733 and weighted average of 19.3%. Similarly, the statistical analysis conducted on geographies consisting of 424,376,046 people shows a moderate positive correlation between the proportion of Spaniards and poverty level among children under the age of 5 in the United States with a correlation coefficient (R) of 0.427 and weighted average of 18.1%, a difference of 6.8%.
Child Poverty Under the Age of 5 Correlation Summary
| Measurement | Trinidadian and Tobagonian | Spaniard |
| Minimum | 2.5% | 11.9% |
| Maximum | 100.0% | 100.0% |
| Range | 97.5% | 88.1% |
| Mean | 23.2% | 34.4% |
| Median | 18.5% | 24.1% |
| Interquartile 25% (IQ1) | 14.8% | 19.0% |
| Interquartile 75% (IQ3) | 23.0% | 36.8% |
| Interquartile Range (IQR) | 8.2% | 17.7% |
| Standard Deviation (Sample) | 17.8% | 24.1% |
| Standard Deviation (Population) | 17.6% | 23.8% |
Similar Demographics by Child Poverty Under the Age of 5
Demographics Similar to Trinidadians and Tobagonians by Child Poverty Under the Age of 5
In terms of child poverty under the age of 5, the demographic groups most similar to Trinidadians and Tobagonians are Sudanese (19.3%, a difference of 0.060%), Immigrants from Micronesia (19.4%, a difference of 0.18%), Immigrants from Laos (19.4%, a difference of 0.39%), Immigrants from Trinidad and Tobago (19.4%, a difference of 0.39%), and Bermudan (19.2%, a difference of 0.56%).
| Demographics | Rating | Rank | Child Poverty Under the Age of 5 |
| Nigerians | 1.6 /100 | #225 | Tragic 19.1% |
| Immigrants | Eritrea | 1.5 /100 | #226 | Tragic 19.1% |
| Cape Verdeans | 1.4 /100 | #227 | Tragic 19.1% |
| Immigrants | Sudan | 1.3 /100 | #228 | Tragic 19.2% |
| Ghanaians | 1.2 /100 | #229 | Tragic 19.2% |
| Ecuadorians | 1.2 /100 | #230 | Tragic 19.2% |
| Bermudans | 1.2 /100 | #231 | Tragic 19.2% |
| Trinidadians and Tobagonians | 0.9 /100 | #232 | Tragic 19.3% |
| Sudanese | 0.9 /100 | #233 | Tragic 19.3% |
| Immigrants | Micronesia | 0.9 /100 | #234 | Tragic 19.4% |
| Immigrants | Laos | 0.8 /100 | #235 | Tragic 19.4% |
| Immigrants | Trinidad and Tobago | 0.8 /100 | #236 | Tragic 19.4% |
| Immigrants | Cabo Verde | 0.6 /100 | #237 | Tragic 19.5% |
| Salvadorans | 0.6 /100 | #238 | Tragic 19.5% |
| Vietnamese | 0.6 /100 | #239 | Tragic 19.5% |
Demographics Similar to Spaniards by Child Poverty Under the Age of 5
In terms of child poverty under the age of 5, the demographic groups most similar to Spaniards are White/Caucasian (18.1%, a difference of 0.060%), Immigrants from Eastern Africa (18.1%, a difference of 0.13%), Immigrants from Cambodia (18.1%, a difference of 0.19%), Japanese (18.1%, a difference of 0.21%), and Ugandan (18.0%, a difference of 0.22%).
| Demographics | Rating | Rank | Child Poverty Under the Age of 5 |
| Celtics | 18.3 /100 | #198 | Poor 17.9% |
| Hungarians | 18.3 /100 | #199 | Poor 17.9% |
| Iraqis | 14.0 /100 | #200 | Poor 18.0% |
| Ugandans | 13.9 /100 | #201 | Poor 18.0% |
| Japanese | 13.8 /100 | #202 | Poor 18.1% |
| Immigrants | Cambodia | 13.7 /100 | #203 | Poor 18.1% |
| Immigrants | Eastern Africa | 13.4 /100 | #204 | Poor 18.1% |
| Spaniards | 12.8 /100 | #205 | Poor 18.1% |
| Whites/Caucasians | 12.6 /100 | #206 | Poor 18.1% |
| Immigrants | Immigrants | 9.9 /100 | #207 | Tragic 18.2% |
| Scotch-Irish | 9.8 /100 | #208 | Tragic 18.2% |
| Spanish | 9.8 /100 | #209 | Tragic 18.2% |
| Panamanians | 9.7 /100 | #210 | Tragic 18.2% |
| Moroccans | 9.4 /100 | #211 | Tragic 18.2% |
| Nepalese | 8.7 /100 | #212 | Tragic 18.3% |