Trinidadian and Tobagonian vs Immigrants from Turkey Child Poverty Under the Age of 5
COMPARE
Trinidadian and Tobagonian
Immigrants from Turkey
Child Poverty Under the Age of 5
Child Poverty Under the Age of 5 Comparison
Trinidadians and Tobagonians
Immigrants from Turkey
19.3%
CHILD POVERTY UNDER THE AGE OF 5
0.9/ 100
METRIC RATING
232nd/ 347
METRIC RANK
15.4%
CHILD POVERTY UNDER THE AGE OF 5
98.3/ 100
METRIC RATING
77th/ 347
METRIC RANK
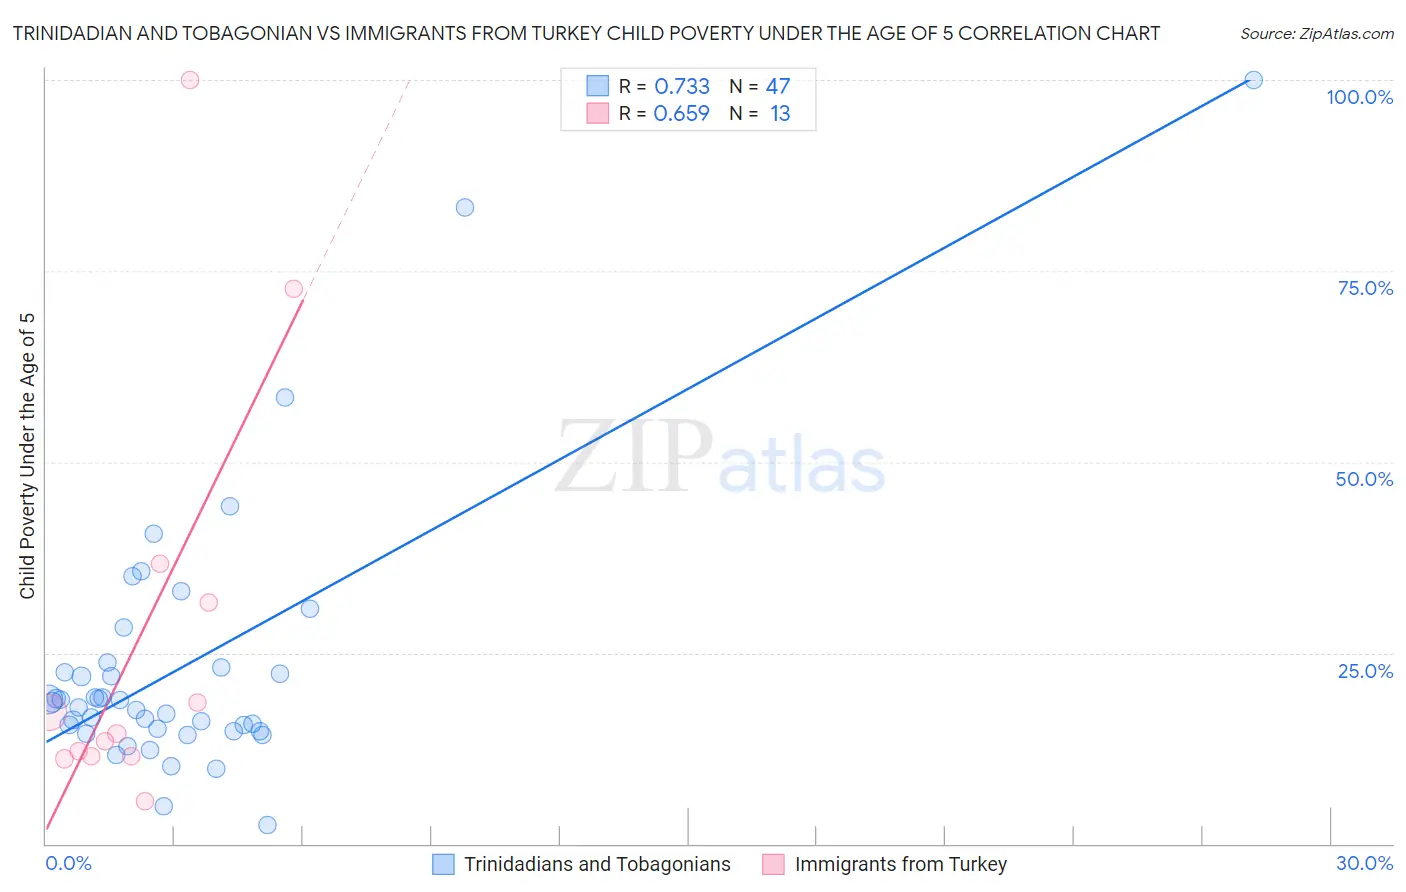
Trinidadian and Tobagonian vs Immigrants from Turkey Child Poverty Under the Age of 5 Correlation Chart
The statistical analysis conducted on geographies consisting of 214,796,578 people shows a strong positive correlation between the proportion of Trinidadians and Tobagonians and poverty level among children under the age of 5 in the United States with a correlation coefficient (R) of 0.733 and weighted average of 19.3%. Similarly, the statistical analysis conducted on geographies consisting of 215,409,827 people shows a significant positive correlation between the proportion of Immigrants from Turkey and poverty level among children under the age of 5 in the United States with a correlation coefficient (R) of 0.659 and weighted average of 15.4%, a difference of 25.4%.
Child Poverty Under the Age of 5 Correlation Summary
| Measurement | Trinidadian and Tobagonian | Immigrants from Turkey |
| Minimum | 2.5% | 5.6% |
| Maximum | 100.0% | 100.0% |
| Range | 97.5% | 94.4% |
| Mean | 23.2% | 27.4% |
| Median | 18.5% | 14.4% |
| Interquartile 25% (IQ1) | 14.8% | 11.5% |
| Interquartile 75% (IQ3) | 23.0% | 34.1% |
| Interquartile Range (IQR) | 8.2% | 22.7% |
| Standard Deviation (Sample) | 17.8% | 28.1% |
| Standard Deviation (Population) | 17.6% | 27.0% |
Similar Demographics by Child Poverty Under the Age of 5
Demographics Similar to Trinidadians and Tobagonians by Child Poverty Under the Age of 5
In terms of child poverty under the age of 5, the demographic groups most similar to Trinidadians and Tobagonians are Sudanese (19.3%, a difference of 0.060%), Immigrants from Micronesia (19.4%, a difference of 0.18%), Immigrants from Laos (19.4%, a difference of 0.39%), Immigrants from Trinidad and Tobago (19.4%, a difference of 0.39%), and Bermudan (19.2%, a difference of 0.56%).
| Demographics | Rating | Rank | Child Poverty Under the Age of 5 |
| Nigerians | 1.6 /100 | #225 | Tragic 19.1% |
| Immigrants | Eritrea | 1.5 /100 | #226 | Tragic 19.1% |
| Cape Verdeans | 1.4 /100 | #227 | Tragic 19.1% |
| Immigrants | Sudan | 1.3 /100 | #228 | Tragic 19.2% |
| Ghanaians | 1.2 /100 | #229 | Tragic 19.2% |
| Ecuadorians | 1.2 /100 | #230 | Tragic 19.2% |
| Bermudans | 1.2 /100 | #231 | Tragic 19.2% |
| Trinidadians and Tobagonians | 0.9 /100 | #232 | Tragic 19.3% |
| Sudanese | 0.9 /100 | #233 | Tragic 19.3% |
| Immigrants | Micronesia | 0.9 /100 | #234 | Tragic 19.4% |
| Immigrants | Laos | 0.8 /100 | #235 | Tragic 19.4% |
| Immigrants | Trinidad and Tobago | 0.8 /100 | #236 | Tragic 19.4% |
| Immigrants | Cabo Verde | 0.6 /100 | #237 | Tragic 19.5% |
| Salvadorans | 0.6 /100 | #238 | Tragic 19.5% |
| Vietnamese | 0.6 /100 | #239 | Tragic 19.5% |
Demographics Similar to Immigrants from Turkey by Child Poverty Under the Age of 5
In terms of child poverty under the age of 5, the demographic groups most similar to Immigrants from Turkey are Immigrants from Argentina (15.4%, a difference of 0.21%), Croatian (15.4%, a difference of 0.21%), Sri Lankan (15.5%, a difference of 0.33%), Argentinean (15.4%, a difference of 0.36%), and Australian (15.5%, a difference of 0.58%).
| Demographics | Rating | Rank | Child Poverty Under the Age of 5 |
| Immigrants | Belgium | 98.8 /100 | #70 | Exceptional 15.3% |
| Immigrants | Egypt | 98.8 /100 | #71 | Exceptional 15.3% |
| Immigrants | Sweden | 98.8 /100 | #72 | Exceptional 15.3% |
| Immigrants | Ukraine | 98.7 /100 | #73 | Exceptional 15.3% |
| Argentineans | 98.5 /100 | #74 | Exceptional 15.4% |
| Immigrants | Argentina | 98.5 /100 | #75 | Exceptional 15.4% |
| Croatians | 98.5 /100 | #76 | Exceptional 15.4% |
| Immigrants | Turkey | 98.3 /100 | #77 | Exceptional 15.4% |
| Sri Lankans | 98.1 /100 | #78 | Exceptional 15.5% |
| Australians | 98.0 /100 | #79 | Exceptional 15.5% |
| Italians | 97.9 /100 | #80 | Exceptional 15.5% |
| Czechs | 97.8 /100 | #81 | Exceptional 15.5% |
| Immigrants | Italy | 97.7 /100 | #82 | Exceptional 15.6% |
| Chileans | 97.6 /100 | #83 | Exceptional 15.6% |
| Immigrants | Netherlands | 97.6 /100 | #84 | Exceptional 15.6% |