Trinidadian and Tobagonian vs Cherokee Child Poverty Under the Age of 5
COMPARE
Trinidadian and Tobagonian
Cherokee
Child Poverty Under the Age of 5
Child Poverty Under the Age of 5 Comparison
Trinidadians and Tobagonians
Cherokee
19.3%
CHILD POVERTY UNDER THE AGE OF 5
0.9/ 100
METRIC RATING
232nd/ 347
METRIC RANK
21.7%
CHILD POVERTY UNDER THE AGE OF 5
0.0/ 100
METRIC RATING
295th/ 347
METRIC RANK
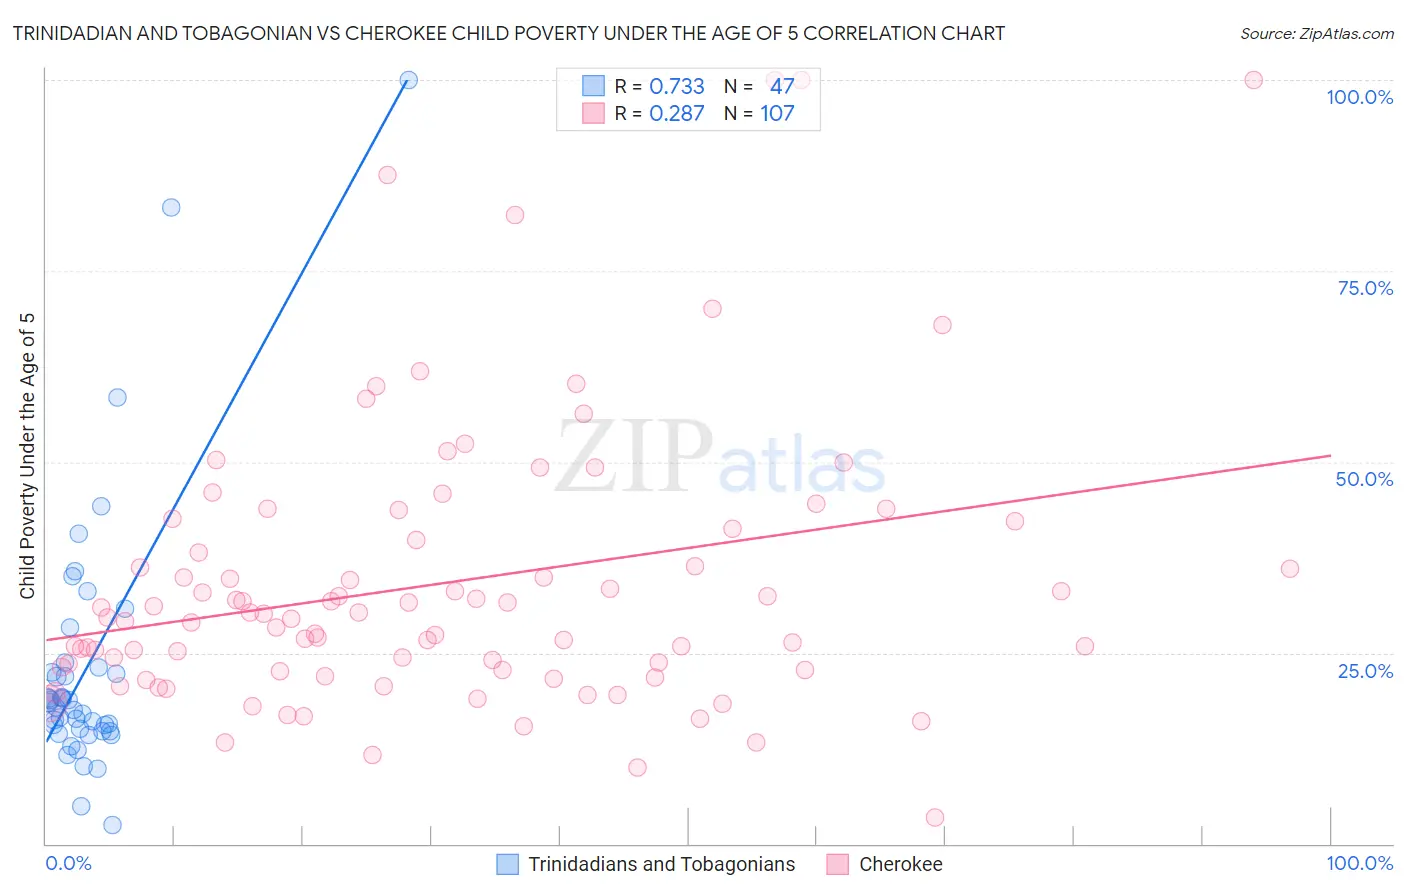
Trinidadian and Tobagonian vs Cherokee Child Poverty Under the Age of 5 Correlation Chart
The statistical analysis conducted on geographies consisting of 214,796,578 people shows a strong positive correlation between the proportion of Trinidadians and Tobagonians and poverty level among children under the age of 5 in the United States with a correlation coefficient (R) of 0.733 and weighted average of 19.3%. Similarly, the statistical analysis conducted on geographies consisting of 472,103,422 people shows a weak positive correlation between the proportion of Cherokee and poverty level among children under the age of 5 in the United States with a correlation coefficient (R) of 0.287 and weighted average of 21.7%, a difference of 12.3%.
Child Poverty Under the Age of 5 Correlation Summary
| Measurement | Trinidadian and Tobagonian | Cherokee |
| Minimum | 2.5% | 3.5% |
| Maximum | 100.0% | 100.0% |
| Range | 97.5% | 96.5% |
| Mean | 23.2% | 34.1% |
| Median | 18.5% | 29.6% |
| Interquartile 25% (IQ1) | 14.8% | 22.7% |
| Interquartile 75% (IQ3) | 23.0% | 41.2% |
| Interquartile Range (IQR) | 8.2% | 18.4% |
| Standard Deviation (Sample) | 17.8% | 18.4% |
| Standard Deviation (Population) | 17.6% | 18.3% |
Similar Demographics by Child Poverty Under the Age of 5
Demographics Similar to Trinidadians and Tobagonians by Child Poverty Under the Age of 5
In terms of child poverty under the age of 5, the demographic groups most similar to Trinidadians and Tobagonians are Sudanese (19.3%, a difference of 0.060%), Immigrants from Micronesia (19.4%, a difference of 0.18%), Immigrants from Laos (19.4%, a difference of 0.39%), Immigrants from Trinidad and Tobago (19.4%, a difference of 0.39%), and Bermudan (19.2%, a difference of 0.56%).
| Demographics | Rating | Rank | Child Poverty Under the Age of 5 |
| Nigerians | 1.6 /100 | #225 | Tragic 19.1% |
| Immigrants | Eritrea | 1.5 /100 | #226 | Tragic 19.1% |
| Cape Verdeans | 1.4 /100 | #227 | Tragic 19.1% |
| Immigrants | Sudan | 1.3 /100 | #228 | Tragic 19.2% |
| Ghanaians | 1.2 /100 | #229 | Tragic 19.2% |
| Ecuadorians | 1.2 /100 | #230 | Tragic 19.2% |
| Bermudans | 1.2 /100 | #231 | Tragic 19.2% |
| Trinidadians and Tobagonians | 0.9 /100 | #232 | Tragic 19.3% |
| Sudanese | 0.9 /100 | #233 | Tragic 19.3% |
| Immigrants | Micronesia | 0.9 /100 | #234 | Tragic 19.4% |
| Immigrants | Laos | 0.8 /100 | #235 | Tragic 19.4% |
| Immigrants | Trinidad and Tobago | 0.8 /100 | #236 | Tragic 19.4% |
| Immigrants | Cabo Verde | 0.6 /100 | #237 | Tragic 19.5% |
| Salvadorans | 0.6 /100 | #238 | Tragic 19.5% |
| Vietnamese | 0.6 /100 | #239 | Tragic 19.5% |
Demographics Similar to Cherokee by Child Poverty Under the Age of 5
In terms of child poverty under the age of 5, the demographic groups most similar to Cherokee are Yaqui (21.7%, a difference of 0.15%), Hispanic or Latino (21.7%, a difference of 0.17%), Guatemalan (21.6%, a difference of 0.26%), Mexican (21.6%, a difference of 0.40%), and Blackfeet (21.8%, a difference of 0.56%).
| Demographics | Rating | Rank | Child Poverty Under the Age of 5 |
| Immigrants | Senegal | 0.0 /100 | #288 | Tragic 21.3% |
| Immigrants | Haiti | 0.0 /100 | #289 | Tragic 21.3% |
| Immigrants | Caribbean | 0.0 /100 | #290 | Tragic 21.4% |
| British West Indians | 0.0 /100 | #291 | Tragic 21.4% |
| Immigrants | Somalia | 0.0 /100 | #292 | Tragic 21.6% |
| Mexicans | 0.0 /100 | #293 | Tragic 21.6% |
| Guatemalans | 0.0 /100 | #294 | Tragic 21.6% |
| Cherokee | 0.0 /100 | #295 | Tragic 21.7% |
| Yaqui | 0.0 /100 | #296 | Tragic 21.7% |
| Hispanics or Latinos | 0.0 /100 | #297 | Tragic 21.7% |
| Blackfeet | 0.0 /100 | #298 | Tragic 21.8% |
| Chickasaw | 0.0 /100 | #299 | Tragic 21.8% |
| Alaskan Athabascans | 0.0 /100 | #300 | Tragic 21.8% |
| Immigrants | Central America | 0.0 /100 | #301 | Tragic 22.0% |
| Iroquois | 0.0 /100 | #302 | Tragic 22.0% |