Tongan vs Immigrants from Belgium Family Poverty

COMPARE

Tongan
Race
Ancestry
AfghanAfricanAlaska NativeAlaskan AthabascanAlbanianAleutAlsatianAmericanApacheArabArapahoArgentineanArmenianAssyrian/Chaldean/SyriacAustralianAustrianBahamianBangladeshiBarbadianBasqueBelgianBelizeanBermudanBhutaneseBlackfeetBolivianBrazilianBritishBritish West IndianBulgarianBurmeseCajunCambodianCanadianCape VerdeanCarpatho RusynCelticCentral AmericanCentral American IndianCherokeeCheyenneChickasawChileanChineseChippewaChoctawColombianColvilleComancheCosta RicanCreeCreekCroatianCrowCubanCypriotCzechCzechoslovakianDanishDelawareDominicanDutchDutch West IndianEastern EuropeanEcuadorianEgyptianEnglishEstonianEthiopianEuropeanFijianFilipinoFinnishFrenchFrench American IndianFrench CanadianGermanGerman RussianGhanaianGreekGuamanian/ChamorroGuatemalanGuyaneseHaitianHmongHonduranHopiHoumaHungarianIcelanderIndian (Asian)IndonesianInupiatIranianIraqiIrishIroquoisIsraeliItalianJamaicanJapaneseJordanianKenyanKiowaKoreanLaotianLatvianLebaneseLiberianLithuanianLumbeeLuxembourgerMacedonianMalaysianMalteseMarshalleseMenomineeMexicanMexican American IndianMongolianMoroccanNative HawaiianNavajoNepaleseNew ZealanderNicaraguanNigerianNorthern EuropeanNorwegianOkinawanOsageOttawaPaiutePakistaniPalestinianPanamanianParaguayanPennsylvania GermanPeruvianPimaPolishPortuguesePotawatomiPuebloPuerto RicanPuget Sound SalishRomanianRussianSalvadoranSamoanScandinavianScotch-IrishScottishSeminoleSenegaleseSerbianShoshoneSierra LeoneanSiouxSlavicSlovakSloveneSomaliSouth AfricanSouth AmericanSouth American IndianSoviet UnionSpaniardSpanishSpanish AmericanSpanish American IndianSri LankanSubsaharan AfricanSudaneseSwedishSwissSyrianTaiwaneseThaiTlingit-HaidaTohono O'OdhamTonganTrinidadian and TobagonianTsimshianTurkishU.S. Virgin IslanderUgandanUkrainianUruguayanUteVenezuelanVietnameseWelshWest IndianYakamaYaquiYugoslavianYumanYup'ikZimbabwean
Immigration
NonimmigrantsImmigrantsAfghanistanAfricaAlbaniaArgentinaArmeniaAsiaAustraliaAustriaBahamasBangladeshBarbadosBelarusBelizeBoliviaBosnia and HerzegovinaBrazilBulgariaBurma/MyanmarCabo VerdeCambodiaCameroonCanadaCaribbeanCentral AmericaChileChinaColombiaCongoCosta RicaCroatiaCubaCzechoslovakiaDenmarkDominicaDominican RepublicEastern AfricaEastern AsiaEastern EuropeEcuadorEgyptEl SalvadorEnglandEritreaEthiopiaEuropeFijiFranceGermanyGhanaGreeceGrenadaGuatemalaGuyanaHaitiHondurasHong KongHungaryIndiaIndonesiaIranIraqIrelandIsraelItalyJamaicaJapanJordanKazakhstanKenyaKoreaKuwaitLaosLatin AmericaLatviaLebanonLiberiaLithuaniaMalaysiaMexicoMicronesiaMiddle AfricaMoldovaMoroccoNepalNetherlandsNicaraguaNigeriaNorth AmericaNorth MacedoniaNorthern AfricaNorthern EuropeNorwayOceaniaPakistanPanamaPeruPhilippinesPolandPortugalRomaniaRussiaSaudi ArabiaScotlandSenegalSerbiaSierra LeoneSingaporeSomaliaSouth AfricaSouth AmericaSouth Central AsiaSouth Eastern AsiaSouthern EuropeSpainSri LankaSt. Vincent and the GrenadinesSudanSwedenSwitzerlandSyriaTaiwanThailandTrinidad and TobagoTurkeyUgandaUkraineUruguayUzbekistanVenezuelaVietnamWest IndiesWestern AfricaWestern AsiaWestern EuropeYemenZaireZimbabweAzores
Immigrants from Belgium
Race
Ancestry
AfghanAfricanAlaska NativeAlaskan AthabascanAlbanianAleutAlsatianAmericanApacheArabArapahoArgentineanArmenianAssyrian/Chaldean/SyriacAustralianAustrianBahamianBangladeshiBarbadianBasqueBelgianBelizeanBermudanBhutaneseBlackfeetBolivianBrazilianBritishBritish West IndianBulgarianBurmeseCajunCambodianCanadianCape VerdeanCarpatho RusynCelticCentral AmericanCentral American IndianCherokeeCheyenneChickasawChileanChineseChippewaChoctawColombianColvilleComancheCosta RicanCreeCreekCroatianCrowCubanCypriotCzechCzechoslovakianDanishDelawareDominicanDutchDutch West IndianEastern EuropeanEcuadorianEgyptianEnglishEstonianEthiopianEuropeanFijianFilipinoFinnishFrenchFrench American IndianFrench CanadianGermanGerman RussianGhanaianGreekGuamanian/ChamorroGuatemalanGuyaneseHaitianHmongHonduranHopiHoumaHungarianIcelanderIndian (Asian)IndonesianInupiatIranianIraqiIrishIroquoisIsraeliItalianJamaicanJapaneseJordanianKenyanKiowaKoreanLaotianLatvianLebaneseLiberianLithuanianLumbeeLuxembourgerMacedonianMalaysianMalteseMarshalleseMenomineeMexicanMexican American IndianMongolianMoroccanNative HawaiianNavajoNepaleseNew ZealanderNicaraguanNigerianNorthern EuropeanNorwegianOkinawanOsageOttawaPaiutePakistaniPalestinianPanamanianParaguayanPennsylvania GermanPeruvianPimaPolishPortuguesePotawatomiPuebloPuerto RicanPuget Sound SalishRomanianRussianSalvadoranSamoanScandinavianScotch-IrishScottishSeminoleSenegaleseSerbianShoshoneSierra LeoneanSiouxSlavicSlovakSloveneSomaliSouth AfricanSouth AmericanSouth American IndianSoviet UnionSpaniardSpanishSpanish AmericanSpanish American IndianSri LankanSubsaharan AfricanSudaneseSwedishSwissSyrianTaiwaneseThaiTlingit-HaidaTohono O'OdhamTrinidadian and TobagonianTsimshianTurkishU.S. Virgin IslanderUgandanUkrainianUruguayanUteVenezuelanVietnameseWelshWest IndianYakamaYaquiYugoslavianYumanYup'ikZimbabwean
Immigration
NonimmigrantsImmigrantsAfghanistanAfricaAlbaniaArgentinaArmeniaAsiaAustraliaAustriaBahamasBangladeshBarbadosBelarusBelgiumBelizeBoliviaBosnia and HerzegovinaBrazilBulgariaBurma/MyanmarCabo VerdeCambodiaCameroonCanadaCaribbeanCentral AmericaChileChinaColombiaCongoCosta RicaCroatiaCubaCzechoslovakiaDenmarkDominicaDominican RepublicEastern AfricaEastern AsiaEastern EuropeEcuadorEgyptEl SalvadorEnglandEritreaEthiopiaEuropeFijiFranceGermanyGhanaGreeceGrenadaGuatemalaGuyanaHaitiHondurasHong KongHungaryIndiaIndonesiaIranIraqIrelandIsraelItalyJamaicaJapanJordanKazakhstanKenyaKoreaKuwaitLaosLatin AmericaLatviaLebanonLiberiaLithuaniaMalaysiaMexicoMicronesiaMiddle AfricaMoldovaMoroccoNepalNetherlandsNicaraguaNigeriaNorth AmericaNorth MacedoniaNorthern AfricaNorthern EuropeNorwayOceaniaPakistanPanamaPeruPhilippinesPolandPortugalRomaniaRussiaSaudi ArabiaScotlandSenegalSerbiaSierra LeoneSingaporeSomaliaSouth AfricaSouth AmericaSouth Central AsiaSouth Eastern AsiaSouthern EuropeSpainSri LankaSt. Vincent and the GrenadinesSudanSwedenSwitzerlandSyriaTaiwanThailandTrinidad and TobagoTurkeyUgandaUkraineUruguayUzbekistanVenezuelaVietnamWest IndiesWestern AfricaWestern AsiaWestern EuropeYemenZaireZimbabweAzores
Family Poverty
Income
Poverty
Unemployment
Labor Participation
Family Structure
Vehicle Availability
Education Level
Disability

Family Poverty Comparison

Tongans

Immigrants from Belgium

Exceptional
Exceptional
7.7%
FAMILY POVERTY
98.9/ 100
METRIC RATING
46th/ 347
METRIC RANK
7.8%
FAMILY POVERTY
98.2/ 100
METRIC RATING
69th/ 347
METRIC RANK

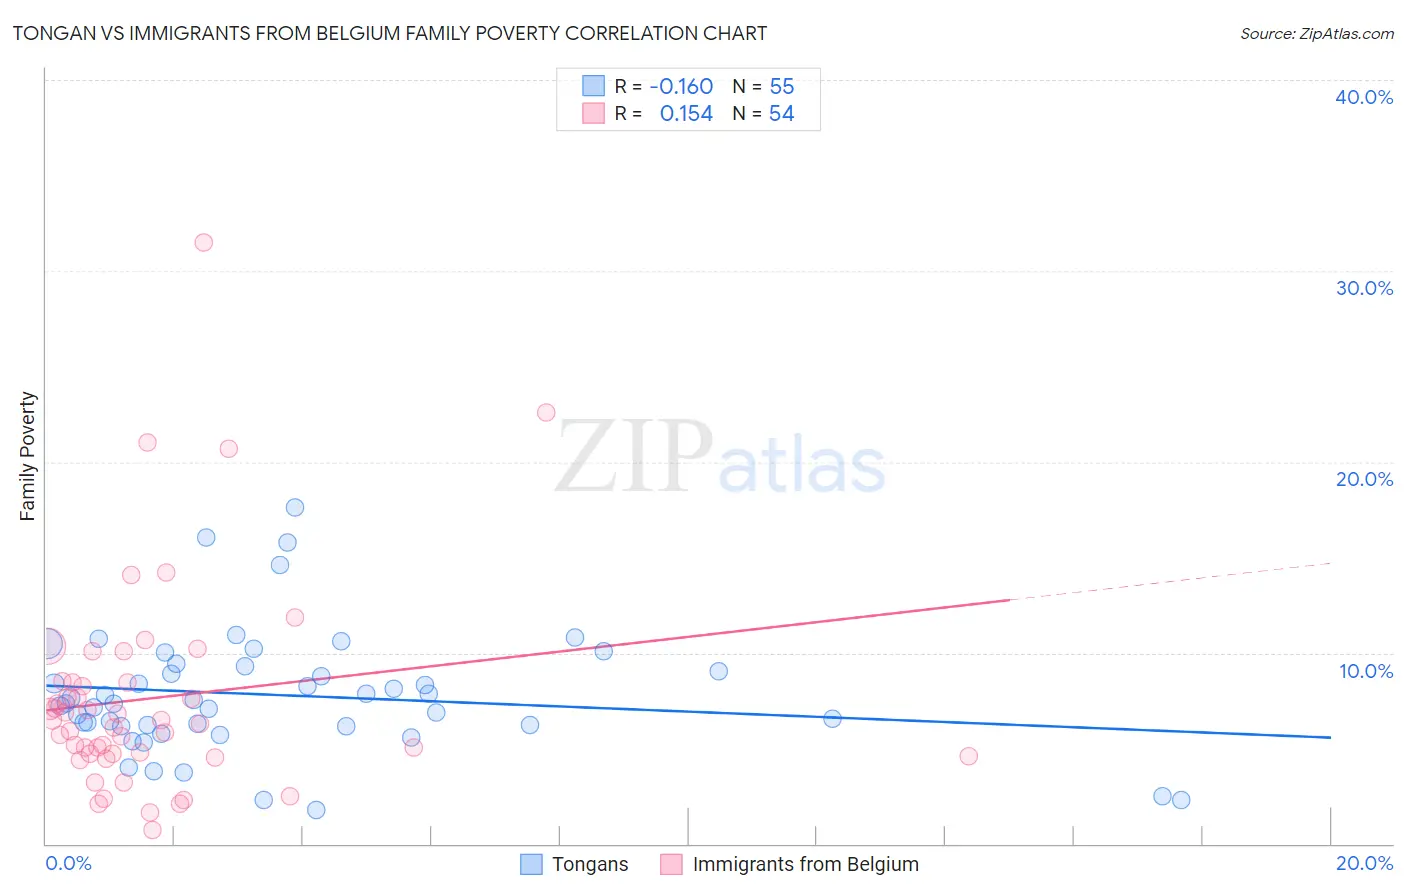
Tongan vs Immigrants from Belgium Family Poverty Correlation Chart

The statistical analysis conducted on geographies consisting of 102,821,565 people shows a poor negative correlation between the proportion of Tongans and poverty level among families in the United States with a correlation coefficient (R) of -0.160 and weighted average of 7.7%. Similarly, the statistical analysis conducted on geographies consisting of 146,524,248 people shows a poor positive correlation between the proportion of Immigrants from Belgium and poverty level among families in the United States with a correlation coefficient (R) of 0.154 and weighted average of 7.8%, a difference of 2.0%.
Tongan vs Immigrants from Belgium Family Poverty

Family Poverty Correlation Summary

MeasurementTonganImmigrants from Belgium
Minimum1.8%0.69%
Maximum17.6%31.5%
Range15.9%30.8%
Mean7.8%7.6%
Median7.3%6.4%
Interquartile 25% (IQ1)6.2%4.7%
Interquartile 75% (IQ3)9.3%8.4%
Interquartile Range (IQR)3.1%3.7%
Standard Deviation (Sample)3.2%5.6%
Standard Deviation (Population)3.2%5.6%

Similar Demographics by Family Poverty

Demographics Similar to Tongans by Family Poverty

In terms of family poverty, the demographic groups most similar to Tongans are Okinawan (7.7%, a difference of 0.010%), Immigrants from Czechoslovakia (7.7%, a difference of 0.010%), Immigrants from Sri Lanka (7.7%, a difference of 0.030%), German (7.7%, a difference of 0.14%), and Immigrants from Bolivia (7.7%, a difference of 0.22%).
DemographicsRating | RankFamily Poverty
Carpatho Rusyns
99.3
/100
|
#39
Exceptional
7.5%
Slovenes
99.3
/100
|
#40
Exceptional
7.5%
Immigrants | Australia
99.2
/100
|
#41
Exceptional
7.6%
Scandinavians
99.1
/100
|
#42
Exceptional
7.6%
Immigrants | Austria
99.1
/100
|
#43
Exceptional
7.6%
Germans
99.0
/100
|
#44
Exceptional
7.7%
Okinawans
98.9
/100
|
#45
Exceptional
7.7%
Tongans
98.9
/100
|
#46
Exceptional
7.7%
Immigrants | Czechoslovakia
98.9
/100
|
#47
Exceptional
7.7%
Immigrants | Sri Lanka
98.9
/100
|
#48
Exceptional
7.7%
Immigrants | Bolivia
98.9
/100
|
#49
Exceptional
7.7%
Immigrants | North Macedonia
98.9
/100
|
#50
Exceptional
7.7%
Immigrants | Moldova
98.8
/100
|
#51
Exceptional
7.7%
Indians (Asian)
98.8
/100
|
#52
Exceptional
7.7%
Swiss
98.8
/100
|
#53
Exceptional
7.7%

Demographics Similar to Immigrants from Belgium by Family Poverty

In terms of family poverty, the demographic groups most similar to Immigrants from Belgium are Australian (7.8%, a difference of 0.010%), Immigrants from Canada (7.8%, a difference of 0.040%), Northern European (7.8%, a difference of 0.050%), Dutch (7.8%, a difference of 0.060%), and Cambodian (7.8%, a difference of 0.060%).
DemographicsRating | RankFamily Poverty
Macedonians
98.6
/100
|
#62
Exceptional
7.8%
Zimbabweans
98.4
/100
|
#63
Exceptional
7.8%
Koreans
98.3
/100
|
#64
Exceptional
7.8%
Immigrants | Bulgaria
98.3
/100
|
#65
Exceptional
7.8%
Dutch
98.3
/100
|
#66
Exceptional
7.8%
Northern Europeans
98.3
/100
|
#67
Exceptional
7.8%
Australians
98.2
/100
|
#68
Exceptional
7.8%
Immigrants | Belgium
98.2
/100
|
#69
Exceptional
7.8%
Immigrants | Canada
98.2
/100
|
#70
Exceptional
7.8%
Cambodians
98.2
/100
|
#71
Exceptional
7.8%
Immigrants | Romania
98.2
/100
|
#72
Exceptional
7.8%
Austrians
98.2
/100
|
#73
Exceptional
7.8%
Immigrants | China
98.1
/100
|
#74
Exceptional
7.8%
Immigrants | Croatia
98.1
/100
|
#75
Exceptional
7.8%
Immigrants | Latvia
98.0
/100
|
#76
Exceptional
7.9%