Tongan vs Immigrants from Bahamas Family Poverty
COMPARE
Tongan
Immigrants from Bahamas
Family Poverty
Family Poverty Comparison
Tongans
Immigrants from Bahamas
7.7%
FAMILY POVERTY
98.9/ 100
METRIC RATING
46th/ 347
METRIC RANK
11.1%
FAMILY POVERTY
0.1/ 100
METRIC RATING
271st/ 347
METRIC RANK
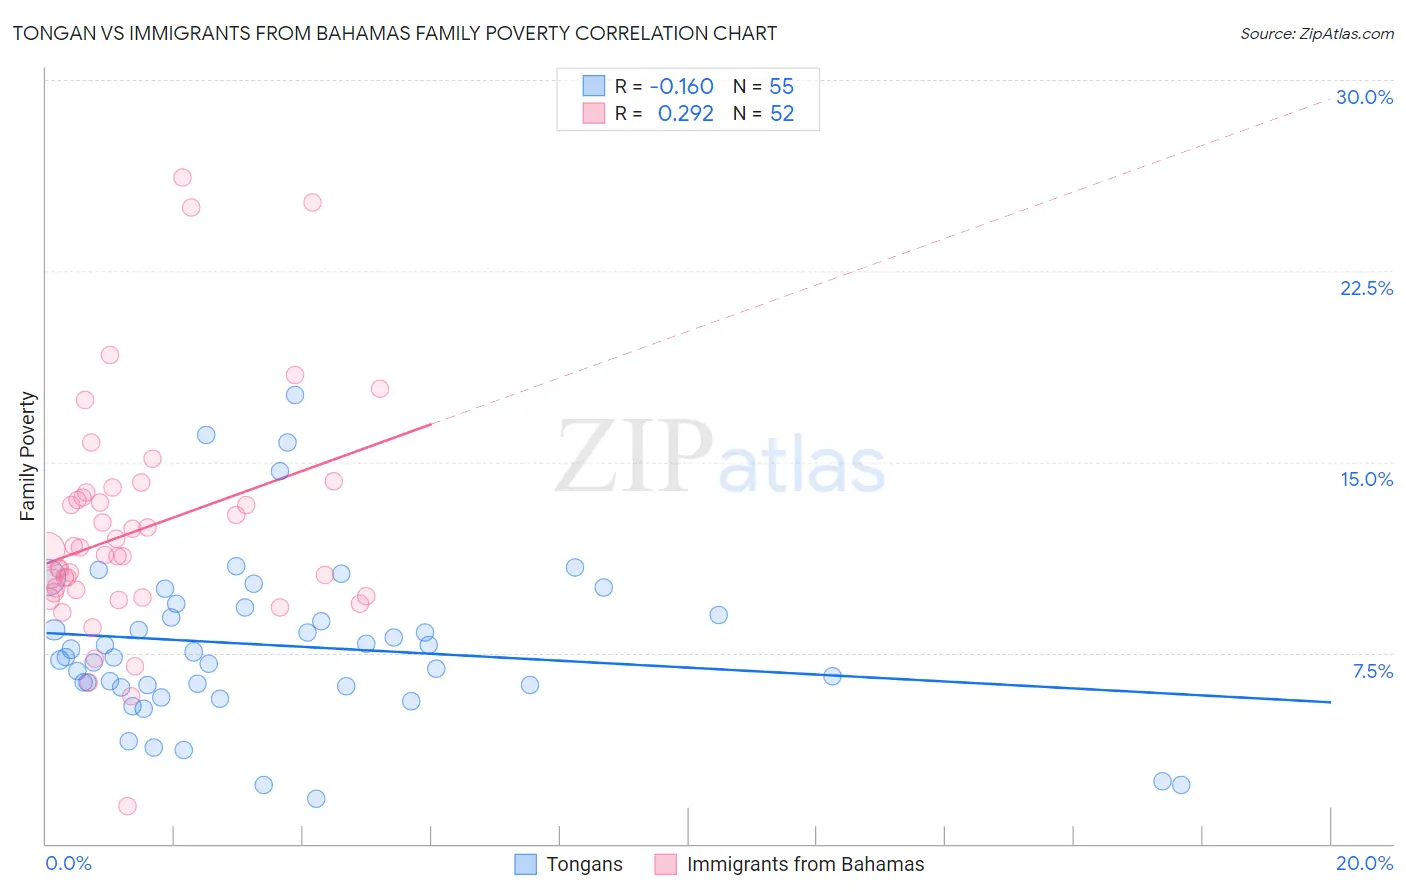
Tongan vs Immigrants from Bahamas Family Poverty Correlation Chart
The statistical analysis conducted on geographies consisting of 102,821,565 people shows a poor negative correlation between the proportion of Tongans and poverty level among families in the United States with a correlation coefficient (R) of -0.160 and weighted average of 7.7%. Similarly, the statistical analysis conducted on geographies consisting of 104,583,559 people shows a weak positive correlation between the proportion of Immigrants from Bahamas and poverty level among families in the United States with a correlation coefficient (R) of 0.292 and weighted average of 11.1%, a difference of 45.3%.
Family Poverty Correlation Summary
| Measurement | Tongan | Immigrants from Bahamas |
| Minimum | 1.8% | 1.5% |
| Maximum | 17.6% | 26.2% |
| Range | 15.9% | 24.7% |
| Mean | 7.8% | 12.3% |
| Median | 7.3% | 11.4% |
| Interquartile 25% (IQ1) | 6.2% | 9.8% |
| Interquartile 75% (IQ3) | 9.3% | 13.7% |
| Interquartile Range (IQR) | 3.1% | 3.9% |
| Standard Deviation (Sample) | 3.2% | 4.6% |
| Standard Deviation (Population) | 3.2% | 4.5% |
Similar Demographics by Family Poverty
Demographics Similar to Tongans by Family Poverty
In terms of family poverty, the demographic groups most similar to Tongans are Okinawan (7.7%, a difference of 0.010%), Immigrants from Czechoslovakia (7.7%, a difference of 0.010%), Immigrants from Sri Lanka (7.7%, a difference of 0.030%), German (7.7%, a difference of 0.14%), and Immigrants from Bolivia (7.7%, a difference of 0.22%).
| Demographics | Rating | Rank | Family Poverty |
| Carpatho Rusyns | 99.3 /100 | #39 | Exceptional 7.5% |
| Slovenes | 99.3 /100 | #40 | Exceptional 7.5% |
| Immigrants | Australia | 99.2 /100 | #41 | Exceptional 7.6% |
| Scandinavians | 99.1 /100 | #42 | Exceptional 7.6% |
| Immigrants | Austria | 99.1 /100 | #43 | Exceptional 7.6% |
| Germans | 99.0 /100 | #44 | Exceptional 7.7% |
| Okinawans | 98.9 /100 | #45 | Exceptional 7.7% |
| Tongans | 98.9 /100 | #46 | Exceptional 7.7% |
| Immigrants | Czechoslovakia | 98.9 /100 | #47 | Exceptional 7.7% |
| Immigrants | Sri Lanka | 98.9 /100 | #48 | Exceptional 7.7% |
| Immigrants | Bolivia | 98.9 /100 | #49 | Exceptional 7.7% |
| Immigrants | North Macedonia | 98.9 /100 | #50 | Exceptional 7.7% |
| Immigrants | Moldova | 98.8 /100 | #51 | Exceptional 7.7% |
| Indians (Asian) | 98.8 /100 | #52 | Exceptional 7.7% |
| Swiss | 98.8 /100 | #53 | Exceptional 7.7% |
Demographics Similar to Immigrants from Bahamas by Family Poverty
In terms of family poverty, the demographic groups most similar to Immigrants from Bahamas are Immigrants from Jamaica (11.2%, a difference of 0.10%), Immigrants from Ecuador (11.1%, a difference of 0.25%), Immigrants from Nicaragua (11.1%, a difference of 0.25%), Somali (11.2%, a difference of 0.61%), and Spanish American (11.2%, a difference of 0.70%).
| Demographics | Rating | Rank | Family Poverty |
| Trinidadians and Tobagonians | 0.1 /100 | #264 | Tragic 10.9% |
| Immigrants | Trinidad and Tobago | 0.1 /100 | #265 | Tragic 10.9% |
| Immigrants | El Salvador | 0.1 /100 | #266 | Tragic 11.0% |
| Comanche | 0.1 /100 | #267 | Tragic 11.0% |
| Jamaicans | 0.1 /100 | #268 | Tragic 11.1% |
| Immigrants | Ecuador | 0.1 /100 | #269 | Tragic 11.1% |
| Immigrants | Nicaragua | 0.1 /100 | #270 | Tragic 11.1% |
| Immigrants | Bahamas | 0.1 /100 | #271 | Tragic 11.1% |
| Immigrants | Jamaica | 0.1 /100 | #272 | Tragic 11.2% |
| Somalis | 0.1 /100 | #273 | Tragic 11.2% |
| Spanish Americans | 0.1 /100 | #274 | Tragic 11.2% |
| Central Americans | 0.1 /100 | #275 | Tragic 11.2% |
| Immigrants | Guyana | 0.1 /100 | #276 | Tragic 11.2% |
| Chippewa | 0.1 /100 | #277 | Tragic 11.2% |
| Guyanese | 0.1 /100 | #278 | Tragic 11.2% |