Tohono O'odham vs Ukrainian Single Father Households
COMPARE
Tohono O'odham
Ukrainian
Single Father Households
Single Father Households Comparison
Tohono O'odham
Ukrainians
3.8%
SINGLE FATHER HOUSEHOLDS
0.0/ 100
METRIC RATING
342nd/ 347
METRIC RANK
2.1%
SINGLE FATHER HOUSEHOLDS
99.3/ 100
METRIC RATING
94th/ 347
METRIC RANK
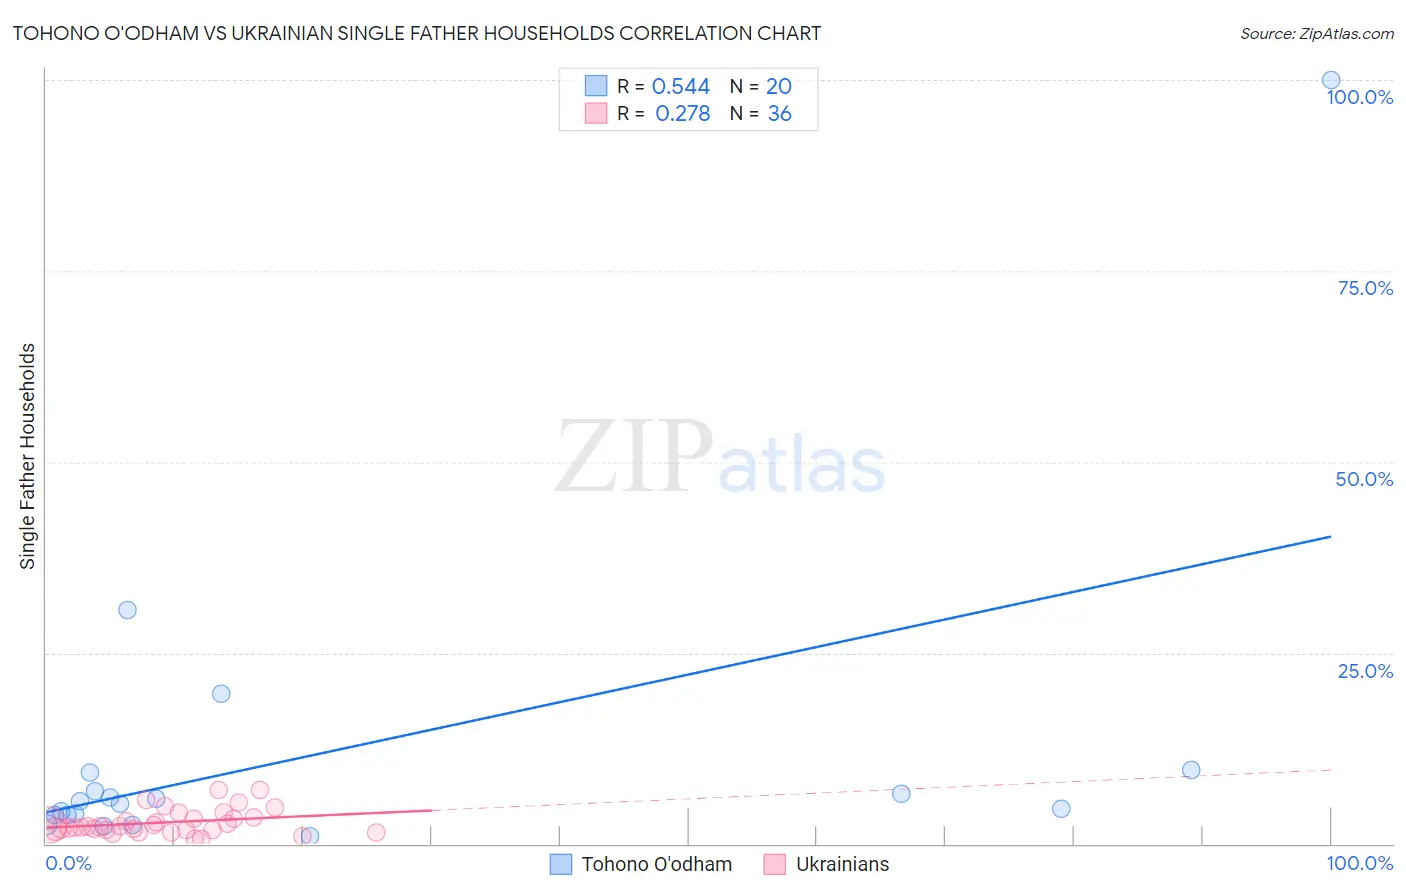
Tohono O'odham vs Ukrainian Single Father Households Correlation Chart
The statistical analysis conducted on geographies consisting of 58,632,927 people shows a substantial positive correlation between the proportion of Tohono O'odham and percentage of single father households in the United States with a correlation coefficient (R) of 0.544 and weighted average of 3.8%. Similarly, the statistical analysis conducted on geographies consisting of 442,446,629 people shows a weak positive correlation between the proportion of Ukrainians and percentage of single father households in the United States with a correlation coefficient (R) of 0.278 and weighted average of 2.1%, a difference of 80.0%.
Single Father Households Correlation Summary
| Measurement | Tohono O'odham | Ukrainian |
| Minimum | 1.0% | 0.63% |
| Maximum | 100.0% | 7.1% |
| Range | 99.0% | 6.5% |
| Mean | 11.7% | 2.8% |
| Median | 5.4% | 2.2% |
| Interquartile 25% (IQ1) | 3.8% | 1.8% |
| Interquartile 75% (IQ3) | 8.1% | 3.4% |
| Interquartile Range (IQR) | 4.3% | 1.5% |
| Standard Deviation (Sample) | 21.9% | 1.6% |
| Standard Deviation (Population) | 21.3% | 1.6% |
Similar Demographics by Single Father Households
Demographics Similar to Tohono O'odham by Single Father Households
In terms of single father households, the demographic groups most similar to Tohono O'odham are Crow (3.5%, a difference of 8.8%), Alaska Native (3.5%, a difference of 9.1%), Pima (4.2%, a difference of 9.2%), Yakama (4.2%, a difference of 9.5%), and Menominee (4.2%, a difference of 10.2%).
| Demographics | Rating | Rank | Single Father Households |
| Natives/Alaskans | 0.0 /100 | #333 | Tragic 3.2% |
| Yuman | 0.0 /100 | #334 | Tragic 3.3% |
| Colville | 0.0 /100 | #335 | Tragic 3.3% |
| Paiute | 0.0 /100 | #336 | Tragic 3.3% |
| Pueblo | 0.0 /100 | #337 | Tragic 3.3% |
| Sioux | 0.0 /100 | #338 | Tragic 3.3% |
| Alaskan Athabascans | 0.0 /100 | #339 | Tragic 3.4% |
| Alaska Natives | 0.0 /100 | #340 | Tragic 3.5% |
| Crow | 0.0 /100 | #341 | Tragic 3.5% |
| Tohono O'odham | 0.0 /100 | #342 | Tragic 3.8% |
| Pima | 0.0 /100 | #343 | Tragic 4.2% |
| Yakama | 0.0 /100 | #344 | Tragic 4.2% |
| Menominee | 0.0 /100 | #345 | Tragic 4.2% |
| Inupiat | 0.0 /100 | #346 | Tragic 4.9% |
| Yup'ik | 0.0 /100 | #347 | Tragic 5.4% |
Demographics Similar to Ukrainians by Single Father Households
In terms of single father households, the demographic groups most similar to Ukrainians are Croatian (2.1%, a difference of 0.0%), Romanian (2.1%, a difference of 0.11%), Immigrants from Guyana (2.1%, a difference of 0.20%), Bermudan (2.1%, a difference of 0.22%), and Arab (2.1%, a difference of 0.37%).
| Demographics | Rating | Rank | Single Father Households |
| Lithuanians | 99.5 /100 | #87 | Exceptional 2.1% |
| Bhutanese | 99.5 /100 | #88 | Exceptional 2.1% |
| Immigrants | Armenia | 99.5 /100 | #89 | Exceptional 2.1% |
| Immigrants | Pakistan | 99.5 /100 | #90 | Exceptional 2.1% |
| Immigrants | Guyana | 99.4 /100 | #91 | Exceptional 2.1% |
| Romanians | 99.4 /100 | #92 | Exceptional 2.1% |
| Croatians | 99.3 /100 | #93 | Exceptional 2.1% |
| Ukrainians | 99.3 /100 | #94 | Exceptional 2.1% |
| Bermudans | 99.2 /100 | #95 | Exceptional 2.1% |
| Arabs | 99.2 /100 | #96 | Exceptional 2.1% |
| Immigrants | Moldova | 99.1 /100 | #97 | Exceptional 2.1% |
| Guyanese | 99.1 /100 | #98 | Exceptional 2.1% |
| South Africans | 99.1 /100 | #99 | Exceptional 2.1% |
| Immigrants | Northern Africa | 99.0 /100 | #100 | Exceptional 2.1% |
| Immigrants | Western Europe | 98.9 /100 | #101 | Exceptional 2.1% |