Tohono O'odham vs Turkish Male Poverty
COMPARE
Tohono O'odham
Turkish
Male Poverty
Male Poverty Comparison
Tohono O'odham
Turks
22.9%
MALE POVERTY
0.0/ 100
METRIC RATING
347th/ 347
METRIC RANK
10.0%
MALE POVERTY
98.9/ 100
METRIC RATING
46th/ 347
METRIC RANK
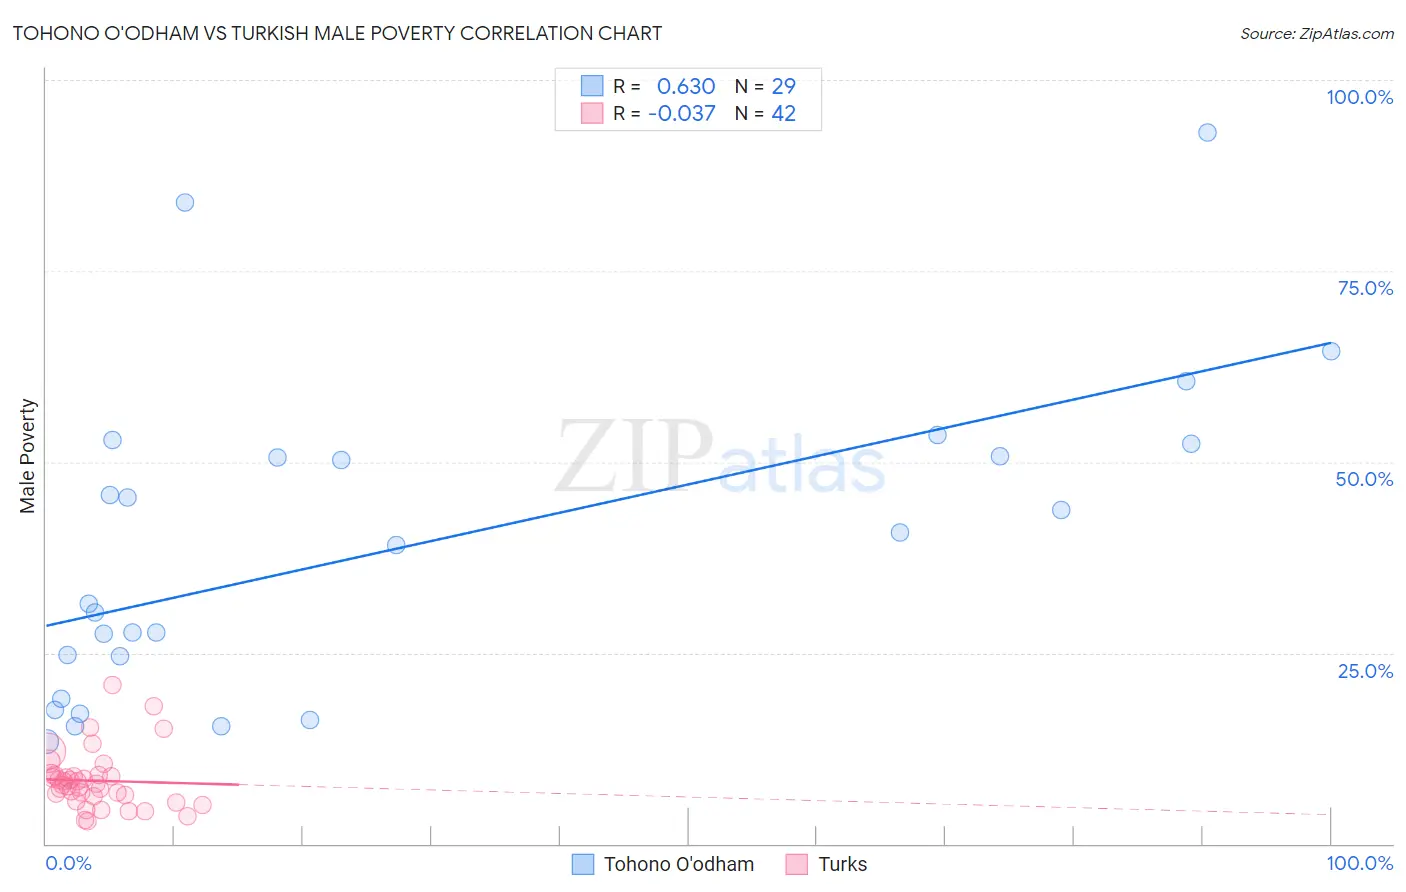
Tohono O'odham vs Turkish Male Poverty Correlation Chart
The statistical analysis conducted on geographies consisting of 58,718,302 people shows a significant positive correlation between the proportion of Tohono O'odham and poverty level among males in the United States with a correlation coefficient (R) of 0.630 and weighted average of 22.9%. Similarly, the statistical analysis conducted on geographies consisting of 271,656,534 people shows no correlation between the proportion of Turks and poverty level among males in the United States with a correlation coefficient (R) of -0.037 and weighted average of 10.0%, a difference of 129.7%.
Male Poverty Correlation Summary
| Measurement | Tohono O'odham | Turkish |
| Minimum | 13.4% | 2.9% |
| Maximum | 93.1% | 20.9% |
| Range | 79.8% | 18.0% |
| Mean | 39.1% | 8.3% |
| Median | 39.0% | 7.8% |
| Interquartile 25% (IQ1) | 21.8% | 6.2% |
| Interquartile 75% (IQ3) | 51.5% | 8.9% |
| Interquartile Range (IQR) | 29.8% | 2.7% |
| Standard Deviation (Sample) | 20.5% | 3.8% |
| Standard Deviation (Population) | 20.1% | 3.7% |
Similar Demographics by Male Poverty
Demographics Similar to Tohono O'odham by Male Poverty
In terms of male poverty, the demographic groups most similar to Tohono O'odham are Navajo (22.3%, a difference of 2.6%), Puerto Rican (22.0%, a difference of 3.9%), Hopi (20.8%, a difference of 10.0%), Yup'ik (20.4%, a difference of 12.3%), and Pima (20.4%, a difference of 12.4%).
| Demographics | Rating | Rank | Male Poverty |
| Natives/Alaskans | 0.0 /100 | #333 | Tragic 16.9% |
| Cheyenne | 0.0 /100 | #334 | Tragic 17.6% |
| Apache | 0.0 /100 | #335 | Tragic 17.7% |
| Pueblo | 0.0 /100 | #336 | Tragic 18.5% |
| Sioux | 0.0 /100 | #337 | Tragic 18.7% |
| Crow | 0.0 /100 | #338 | Tragic 19.1% |
| Yuman | 0.0 /100 | #339 | Tragic 19.5% |
| Immigrants | Yemen | 0.0 /100 | #340 | Tragic 20.1% |
| Lumbee | 0.0 /100 | #341 | Tragic 20.2% |
| Pima | 0.0 /100 | #342 | Tragic 20.4% |
| Yup'ik | 0.0 /100 | #343 | Tragic 20.4% |
| Hopi | 0.0 /100 | #344 | Tragic 20.8% |
| Puerto Ricans | 0.0 /100 | #345 | Tragic 22.0% |
| Navajo | 0.0 /100 | #346 | Tragic 22.3% |
| Tohono O'odham | 0.0 /100 | #347 | Tragic 22.9% |
Demographics Similar to Turks by Male Poverty
In terms of male poverty, the demographic groups most similar to Turks are Immigrants from Serbia (10.0%, a difference of 0.020%), Immigrants from Singapore (10.0%, a difference of 0.13%), Immigrants from Japan (10.0%, a difference of 0.13%), Immigrants from Romania (9.9%, a difference of 0.20%), and Slovene (10.0%, a difference of 0.23%).
| Demographics | Rating | Rank | Male Poverty |
| Russians | 99.2 /100 | #39 | Exceptional 9.9% |
| Cypriots | 99.2 /100 | #40 | Exceptional 9.9% |
| Koreans | 99.2 /100 | #41 | Exceptional 9.9% |
| Immigrants | Iran | 99.1 /100 | #42 | Exceptional 9.9% |
| Immigrants | Moldova | 99.0 /100 | #43 | Exceptional 9.9% |
| Immigrants | Romania | 98.9 /100 | #44 | Exceptional 9.9% |
| Immigrants | Serbia | 98.9 /100 | #45 | Exceptional 10.0% |
| Turks | 98.9 /100 | #46 | Exceptional 10.0% |
| Immigrants | Singapore | 98.8 /100 | #47 | Exceptional 10.0% |
| Immigrants | Japan | 98.8 /100 | #48 | Exceptional 10.0% |
| Slovenes | 98.8 /100 | #49 | Exceptional 10.0% |
| Immigrants | Philippines | 98.7 /100 | #50 | Exceptional 10.0% |
| Immigrants | Croatia | 98.7 /100 | #51 | Exceptional 10.0% |
| Asians | 98.7 /100 | #52 | Exceptional 10.0% |
| Immigrants | Czechoslovakia | 98.6 /100 | #53 | Exceptional 10.0% |