Dutch West Indian vs Turkish Male Poverty
COMPARE
Dutch West Indian
Turkish
Male Poverty
Male Poverty Comparison
Dutch West Indians
Turks
14.2%
MALE POVERTY
0.0/ 100
METRIC RATING
307th/ 347
METRIC RANK
10.0%
MALE POVERTY
98.9/ 100
METRIC RATING
46th/ 347
METRIC RANK
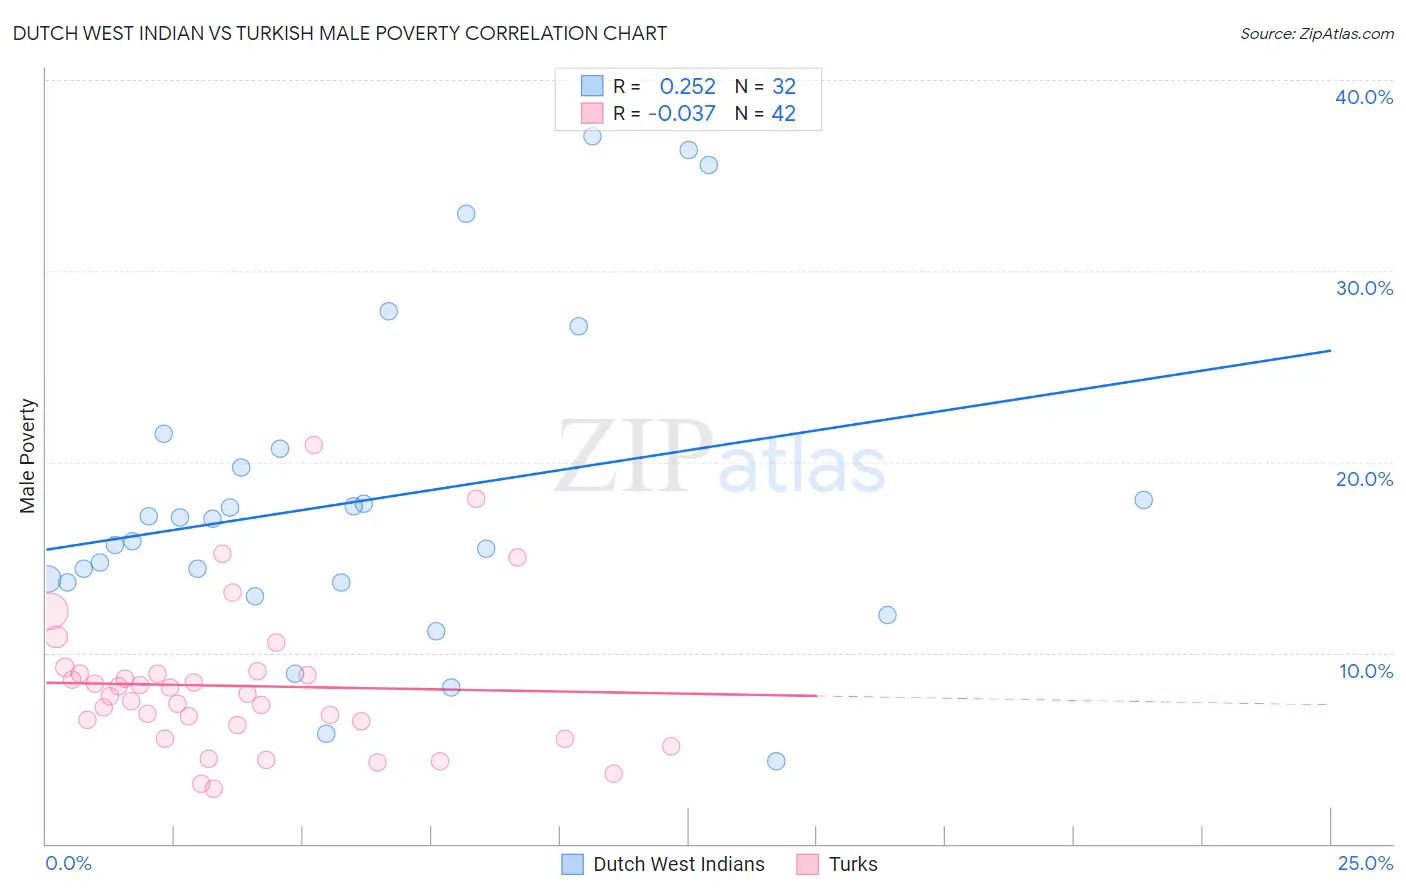
Dutch West Indian vs Turkish Male Poverty Correlation Chart
The statistical analysis conducted on geographies consisting of 85,761,209 people shows a weak positive correlation between the proportion of Dutch West Indians and poverty level among males in the United States with a correlation coefficient (R) of 0.252 and weighted average of 14.2%. Similarly, the statistical analysis conducted on geographies consisting of 271,656,534 people shows no correlation between the proportion of Turks and poverty level among males in the United States with a correlation coefficient (R) of -0.037 and weighted average of 10.0%, a difference of 42.6%.
Male Poverty Correlation Summary
| Measurement | Dutch West Indian | Turkish |
| Minimum | 4.3% | 2.9% |
| Maximum | 37.0% | 20.9% |
| Range | 32.7% | 18.0% |
| Mean | 18.0% | 8.3% |
| Median | 16.4% | 7.8% |
| Interquartile 25% (IQ1) | 13.7% | 6.2% |
| Interquartile 75% (IQ3) | 20.2% | 8.9% |
| Interquartile Range (IQR) | 6.5% | 2.7% |
| Standard Deviation (Sample) | 8.4% | 3.8% |
| Standard Deviation (Population) | 8.2% | 3.7% |
Similar Demographics by Male Poverty
Demographics Similar to Dutch West Indians by Male Poverty
In terms of male poverty, the demographic groups most similar to Dutch West Indians are African (14.2%, a difference of 0.020%), Somali (14.3%, a difference of 0.40%), Seminole (14.3%, a difference of 0.60%), Creek (14.1%, a difference of 0.70%), and Immigrants from Bangladesh (14.1%, a difference of 0.77%).
| Demographics | Rating | Rank | Male Poverty |
| Immigrants | Mexico | 0.0 /100 | #300 | Tragic 14.0% |
| Immigrants | Senegal | 0.0 /100 | #301 | Tragic 14.0% |
| Immigrants | Caribbean | 0.0 /100 | #302 | Tragic 14.0% |
| Bahamians | 0.0 /100 | #303 | Tragic 14.1% |
| Senegalese | 0.0 /100 | #304 | Tragic 14.1% |
| Immigrants | Bangladesh | 0.0 /100 | #305 | Tragic 14.1% |
| Creek | 0.0 /100 | #306 | Tragic 14.1% |
| Dutch West Indians | 0.0 /100 | #307 | Tragic 14.2% |
| Africans | 0.0 /100 | #308 | Tragic 14.2% |
| Somalis | 0.0 /100 | #309 | Tragic 14.3% |
| Seminole | 0.0 /100 | #310 | Tragic 14.3% |
| Hondurans | 0.0 /100 | #311 | Tragic 14.3% |
| Choctaw | 0.0 /100 | #312 | Tragic 14.4% |
| Immigrants | Somalia | 0.0 /100 | #313 | Tragic 14.6% |
| Immigrants | Honduras | 0.0 /100 | #314 | Tragic 14.6% |
Demographics Similar to Turks by Male Poverty
In terms of male poverty, the demographic groups most similar to Turks are Immigrants from Serbia (10.0%, a difference of 0.020%), Immigrants from Singapore (10.0%, a difference of 0.13%), Immigrants from Japan (10.0%, a difference of 0.13%), Immigrants from Romania (9.9%, a difference of 0.20%), and Slovene (10.0%, a difference of 0.23%).
| Demographics | Rating | Rank | Male Poverty |
| Russians | 99.2 /100 | #39 | Exceptional 9.9% |
| Cypriots | 99.2 /100 | #40 | Exceptional 9.9% |
| Koreans | 99.2 /100 | #41 | Exceptional 9.9% |
| Immigrants | Iran | 99.1 /100 | #42 | Exceptional 9.9% |
| Immigrants | Moldova | 99.0 /100 | #43 | Exceptional 9.9% |
| Immigrants | Romania | 98.9 /100 | #44 | Exceptional 9.9% |
| Immigrants | Serbia | 98.9 /100 | #45 | Exceptional 10.0% |
| Turks | 98.9 /100 | #46 | Exceptional 10.0% |
| Immigrants | Singapore | 98.8 /100 | #47 | Exceptional 10.0% |
| Immigrants | Japan | 98.8 /100 | #48 | Exceptional 10.0% |
| Slovenes | 98.8 /100 | #49 | Exceptional 10.0% |
| Immigrants | Philippines | 98.7 /100 | #50 | Exceptional 10.0% |
| Immigrants | Croatia | 98.7 /100 | #51 | Exceptional 10.0% |
| Asians | 98.7 /100 | #52 | Exceptional 10.0% |
| Immigrants | Czechoslovakia | 98.6 /100 | #53 | Exceptional 10.0% |