Tohono O'odham vs Turkish Seniors Poverty Over the Age of 65
COMPARE
Tohono O'odham
Turkish
Seniors Poverty Over the Age of 65
Seniors Poverty Over the Age of 65 Comparison
Tohono O'odham
Turks
20.8%
SENIORS POVERTY OVER THE AGE OF 65
0.0/ 100
METRIC RATING
346th/ 347
METRIC RANK
10.0%
SENIORS POVERTY OVER THE AGE OF 65
97.9/ 100
METRIC RATING
74th/ 347
METRIC RANK
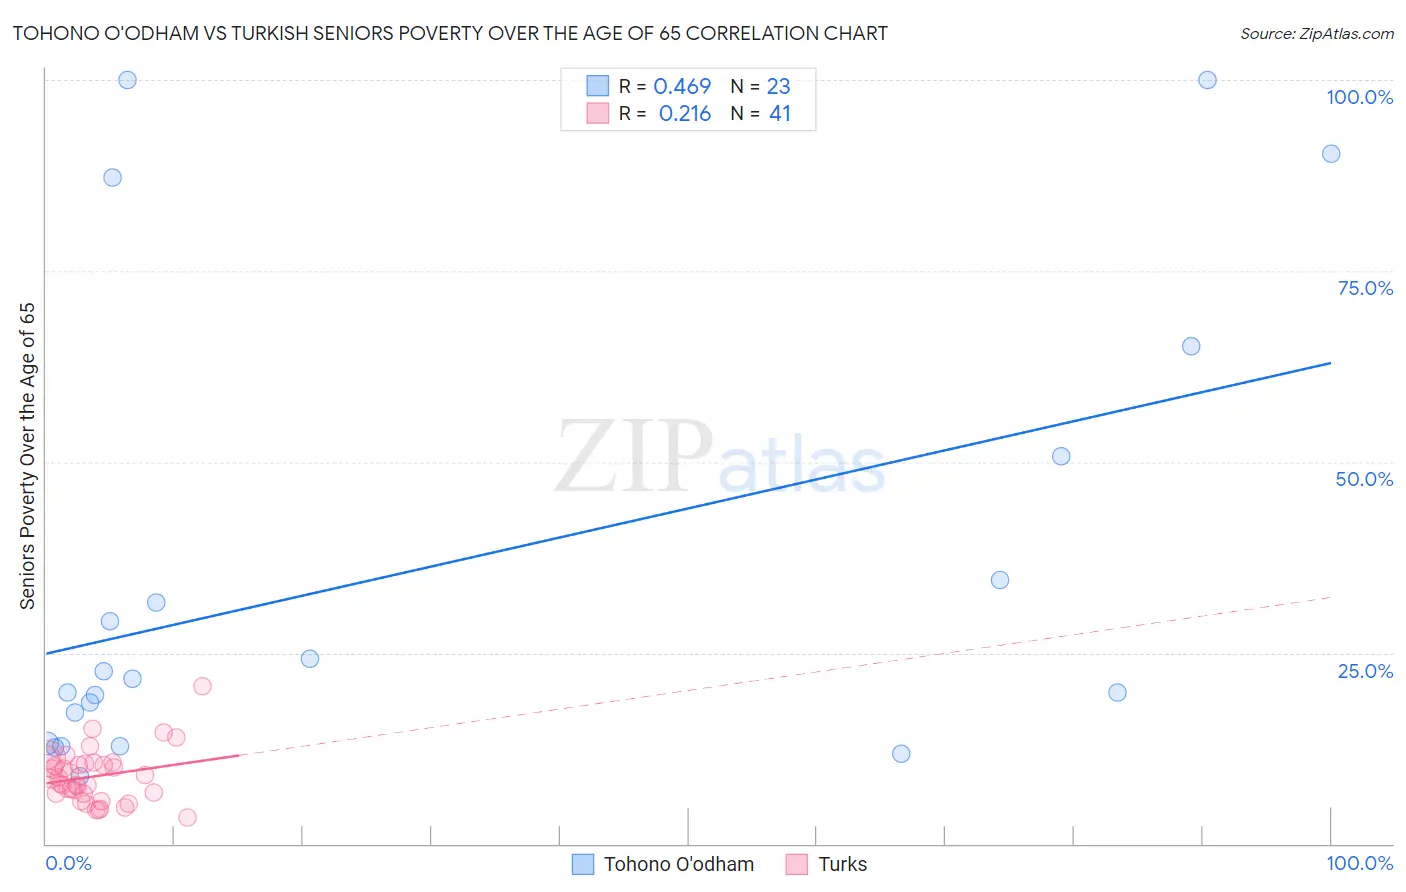
Tohono O'odham vs Turkish Seniors Poverty Over the Age of 65 Correlation Chart
The statistical analysis conducted on geographies consisting of 58,655,684 people shows a moderate positive correlation between the proportion of Tohono O'odham and poverty level among seniors over the age of 65 in the United States with a correlation coefficient (R) of 0.469 and weighted average of 20.8%. Similarly, the statistical analysis conducted on geographies consisting of 271,163,307 people shows a weak positive correlation between the proportion of Turks and poverty level among seniors over the age of 65 in the United States with a correlation coefficient (R) of 0.216 and weighted average of 10.0%, a difference of 108.3%.
Seniors Poverty Over the Age of 65 Correlation Summary
| Measurement | Tohono O'odham | Turkish |
| Minimum | 8.8% | 3.5% |
| Maximum | 100.0% | 20.6% |
| Range | 91.2% | 17.1% |
| Mean | 35.8% | 8.8% |
| Median | 21.6% | 8.5% |
| Interquartile 25% (IQ1) | 13.2% | 6.6% |
| Interquartile 75% (IQ3) | 50.7% | 10.5% |
| Interquartile Range (IQR) | 37.6% | 3.9% |
| Standard Deviation (Sample) | 30.4% | 3.4% |
| Standard Deviation (Population) | 29.8% | 3.4% |
Similar Demographics by Seniors Poverty Over the Age of 65
Demographics Similar to Tohono O'odham by Seniors Poverty Over the Age of 65
In terms of seniors poverty over the age of 65, the demographic groups most similar to Tohono O'odham are Puerto Rican (21.4%, a difference of 2.7%), Pima (19.8%, a difference of 5.2%), Immigrants from Dominican Republic (18.3%, a difference of 13.9%), Lumbee (18.1%, a difference of 14.9%), and Immigrants from Cuba (17.9%, a difference of 16.2%).
| Demographics | Rating | Rank | Seniors Poverty Over the Age of 65 |
| Immigrants | Yemen | 0.0 /100 | #333 | Tragic 15.9% |
| Immigrants | Nicaragua | 0.0 /100 | #334 | Tragic 15.9% |
| Cubans | 0.0 /100 | #335 | Tragic 16.1% |
| Immigrants | Cabo Verde | 0.0 /100 | #336 | Tragic 16.2% |
| Immigrants | Caribbean | 0.0 /100 | #337 | Tragic 16.5% |
| Pueblo | 0.0 /100 | #338 | Tragic 17.2% |
| Navajo | 0.0 /100 | #339 | Tragic 17.5% |
| Hopi | 0.0 /100 | #340 | Tragic 17.8% |
| Dominicans | 0.0 /100 | #341 | Tragic 17.8% |
| Immigrants | Cuba | 0.0 /100 | #342 | Tragic 17.9% |
| Lumbee | 0.0 /100 | #343 | Tragic 18.1% |
| Immigrants | Dominican Republic | 0.0 /100 | #344 | Tragic 18.3% |
| Pima | 0.0 /100 | #345 | Tragic 19.8% |
| Tohono O'odham | 0.0 /100 | #346 | Tragic 20.8% |
| Puerto Ricans | 0.0 /100 | #347 | Tragic 21.4% |
Demographics Similar to Turks by Seniors Poverty Over the Age of 65
In terms of seniors poverty over the age of 65, the demographic groups most similar to Turks are Russian (10.0%, a difference of 0.020%), Palestinian (10.0%, a difference of 0.050%), Yugoslavian (10.0%, a difference of 0.070%), Immigrants from Czechoslovakia (10.0%, a difference of 0.090%), and Samoan (10.0%, a difference of 0.11%).
| Demographics | Rating | Rank | Seniors Poverty Over the Age of 65 |
| Immigrants | Austria | 98.6 /100 | #67 | Exceptional 9.9% |
| Canadians | 98.5 /100 | #68 | Exceptional 9.9% |
| Australians | 98.4 /100 | #69 | Exceptional 9.9% |
| Samoans | 98.0 /100 | #70 | Exceptional 10.0% |
| Yugoslavians | 97.9 /100 | #71 | Exceptional 10.0% |
| Palestinians | 97.9 /100 | #72 | Exceptional 10.0% |
| Russians | 97.9 /100 | #73 | Exceptional 10.0% |
| Turks | 97.9 /100 | #74 | Exceptional 10.0% |
| Immigrants | Czechoslovakia | 97.8 /100 | #75 | Exceptional 10.0% |
| New Zealanders | 97.7 /100 | #76 | Exceptional 10.0% |
| Immigrants | South Africa | 97.7 /100 | #77 | Exceptional 10.0% |
| Whites/Caucasians | 97.5 /100 | #78 | Exceptional 10.0% |
| Immigrants | Ireland | 97.5 /100 | #79 | Exceptional 10.0% |
| Koreans | 97.4 /100 | #80 | Exceptional 10.1% |
| Immigrants | Sri Lanka | 97.3 /100 | #81 | Exceptional 10.1% |