Tohono O'odham vs Central American Indian Male Poverty
COMPARE
Tohono O'odham
Central American Indian
Male Poverty
Male Poverty Comparison
Tohono O'odham
Central American Indians
22.9%
MALE POVERTY
0.0/ 100
METRIC RATING
347th/ 347
METRIC RANK
15.3%
MALE POVERTY
0.0/ 100
METRIC RATING
326th/ 347
METRIC RANK
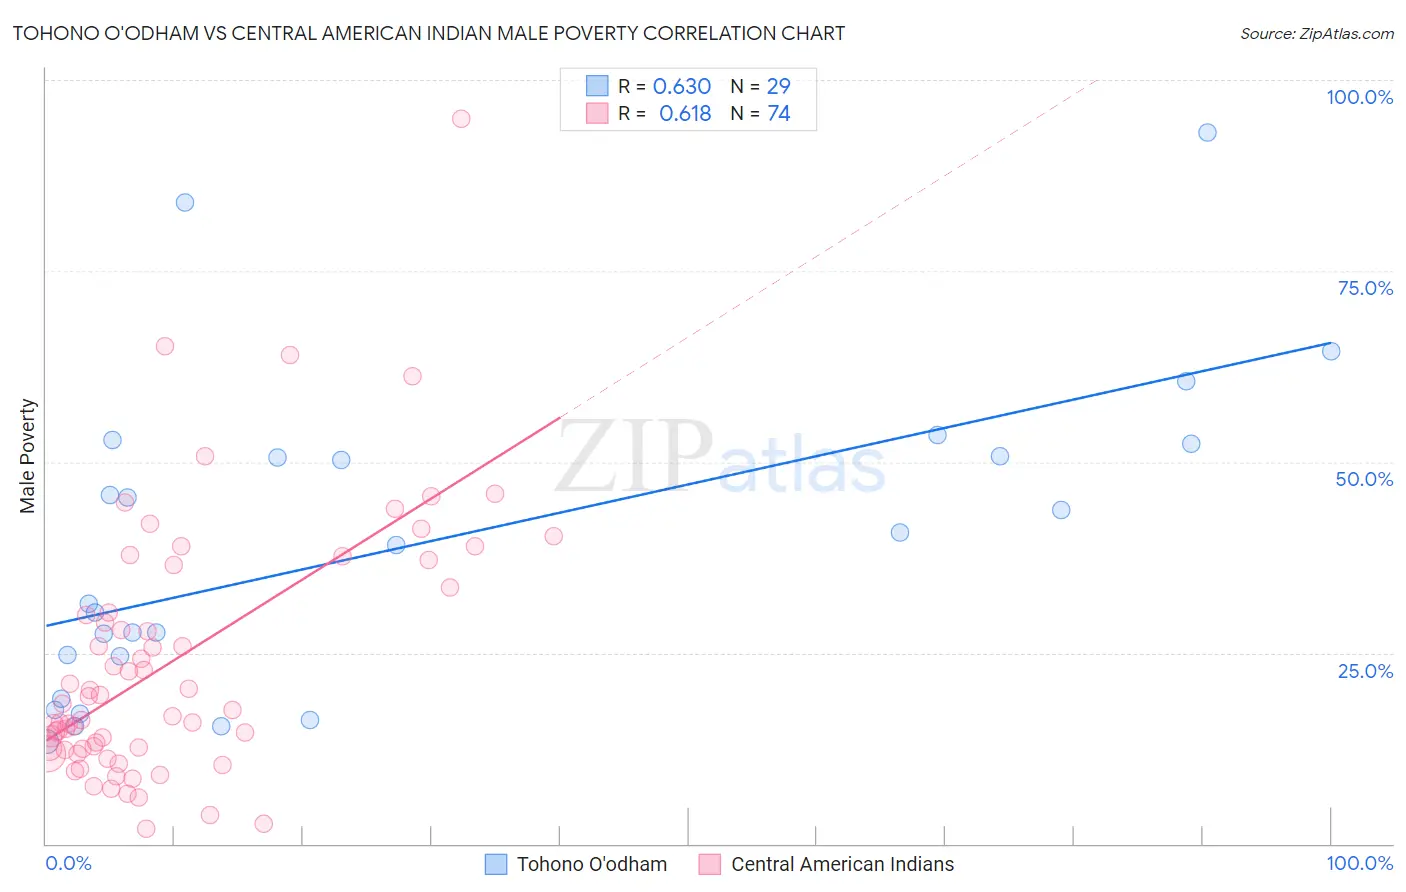
Tohono O'odham vs Central American Indian Male Poverty Correlation Chart
The statistical analysis conducted on geographies consisting of 58,718,302 people shows a significant positive correlation between the proportion of Tohono O'odham and poverty level among males in the United States with a correlation coefficient (R) of 0.630 and weighted average of 22.9%. Similarly, the statistical analysis conducted on geographies consisting of 326,052,023 people shows a significant positive correlation between the proportion of Central American Indians and poverty level among males in the United States with a correlation coefficient (R) of 0.618 and weighted average of 15.3%, a difference of 49.4%.
Male Poverty Correlation Summary
| Measurement | Tohono O'odham | Central American Indian |
| Minimum | 13.4% | 1.9% |
| Maximum | 93.1% | 94.9% |
| Range | 79.8% | 93.0% |
| Mean | 39.1% | 23.8% |
| Median | 39.0% | 17.9% |
| Interquartile 25% (IQ1) | 21.8% | 12.5% |
| Interquartile 75% (IQ3) | 51.5% | 33.5% |
| Interquartile Range (IQR) | 29.8% | 21.1% |
| Standard Deviation (Sample) | 20.5% | 16.9% |
| Standard Deviation (Population) | 20.1% | 16.8% |
Similar Demographics by Male Poverty
Demographics Similar to Tohono O'odham by Male Poverty
In terms of male poverty, the demographic groups most similar to Tohono O'odham are Navajo (22.3%, a difference of 2.6%), Puerto Rican (22.0%, a difference of 3.9%), Hopi (20.8%, a difference of 10.0%), Yup'ik (20.4%, a difference of 12.3%), and Pima (20.4%, a difference of 12.4%).
| Demographics | Rating | Rank | Male Poverty |
| Natives/Alaskans | 0.0 /100 | #333 | Tragic 16.9% |
| Cheyenne | 0.0 /100 | #334 | Tragic 17.6% |
| Apache | 0.0 /100 | #335 | Tragic 17.7% |
| Pueblo | 0.0 /100 | #336 | Tragic 18.5% |
| Sioux | 0.0 /100 | #337 | Tragic 18.7% |
| Crow | 0.0 /100 | #338 | Tragic 19.1% |
| Yuman | 0.0 /100 | #339 | Tragic 19.5% |
| Immigrants | Yemen | 0.0 /100 | #340 | Tragic 20.1% |
| Lumbee | 0.0 /100 | #341 | Tragic 20.2% |
| Pima | 0.0 /100 | #342 | Tragic 20.4% |
| Yup'ik | 0.0 /100 | #343 | Tragic 20.4% |
| Hopi | 0.0 /100 | #344 | Tragic 20.8% |
| Puerto Ricans | 0.0 /100 | #345 | Tragic 22.0% |
| Navajo | 0.0 /100 | #346 | Tragic 22.3% |
| Tohono O'odham | 0.0 /100 | #347 | Tragic 22.9% |
Demographics Similar to Central American Indians by Male Poverty
In terms of male poverty, the demographic groups most similar to Central American Indians are Yakama (15.3%, a difference of 0.11%), Menominee (15.3%, a difference of 0.29%), Colville (15.2%, a difference of 0.48%), Kiowa (15.2%, a difference of 0.87%), and Arapaho (15.1%, a difference of 1.6%).
| Demographics | Rating | Rank | Male Poverty |
| U.S. Virgin Islanders | 0.0 /100 | #319 | Tragic 14.7% |
| Immigrants | Congo | 0.0 /100 | #320 | Tragic 14.7% |
| Arapaho | 0.0 /100 | #321 | Tragic 15.1% |
| Kiowa | 0.0 /100 | #322 | Tragic 15.2% |
| Colville | 0.0 /100 | #323 | Tragic 15.2% |
| Menominee | 0.0 /100 | #324 | Tragic 15.3% |
| Yakama | 0.0 /100 | #325 | Tragic 15.3% |
| Central American Indians | 0.0 /100 | #326 | Tragic 15.3% |
| Paiute | 0.0 /100 | #327 | Tragic 15.8% |
| Blacks/African Americans | 0.0 /100 | #328 | Tragic 15.8% |
| Dominicans | 0.0 /100 | #329 | Tragic 16.1% |
| Immigrants | Dominican Republic | 0.0 /100 | #330 | Tragic 16.2% |
| Ute | 0.0 /100 | #331 | Tragic 16.2% |
| Houma | 0.0 /100 | #332 | Tragic 16.7% |
| Natives/Alaskans | 0.0 /100 | #333 | Tragic 16.9% |