Tohono O'odham vs Nonimmigrants Unemployment
COMPARE
Tohono O'odham
Nonimmigrants
Unemployment
Unemployment Comparison
Tohono O'odham
Nonimmigrants
8.9%
UNEMPLOYMENT
0.0/ 100
METRIC RATING
341st/ 347
METRIC RANK
5.3%
UNEMPLOYMENT
47.9/ 100
METRIC RATING
177th/ 347
METRIC RANK
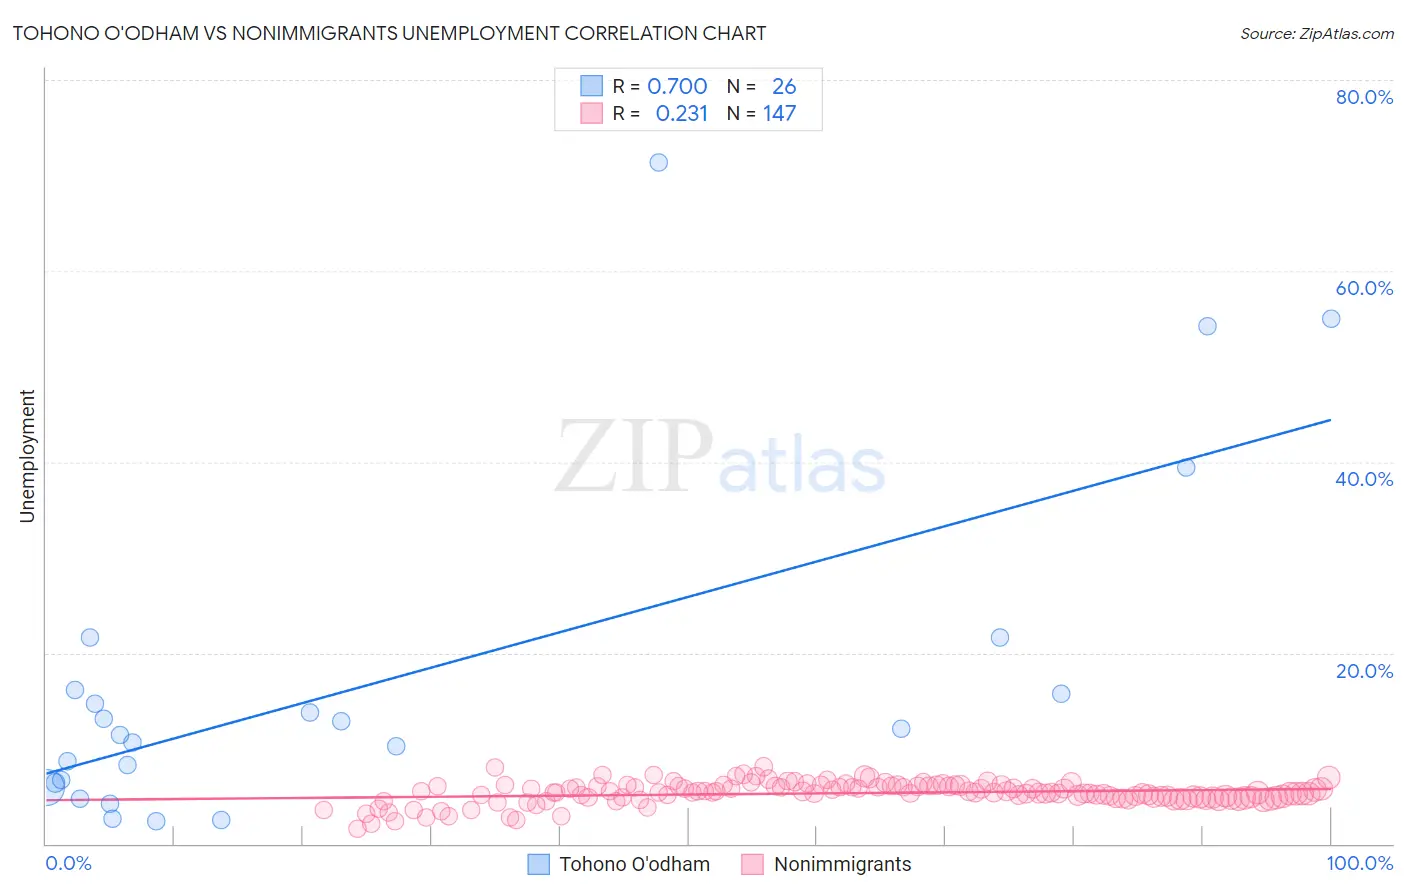
Tohono O'odham vs Nonimmigrants Unemployment Correlation Chart
The statistical analysis conducted on geographies consisting of 58,714,465 people shows a strong positive correlation between the proportion of Tohono O'odham and unemployment in the United States with a correlation coefficient (R) of 0.700 and weighted average of 8.9%. Similarly, the statistical analysis conducted on geographies consisting of 578,965,270 people shows a weak positive correlation between the proportion of Nonimmigrants and unemployment in the United States with a correlation coefficient (R) of 0.231 and weighted average of 5.3%, a difference of 68.6%.
Unemployment Correlation Summary
| Measurement | Tohono O'odham | Nonimmigrants |
| Minimum | 2.4% | 1.6% |
| Maximum | 71.4% | 8.1% |
| Range | 69.0% | 6.5% |
| Mean | 17.2% | 5.3% |
| Median | 11.8% | 5.4% |
| Interquartile 25% (IQ1) | 6.4% | 4.8% |
| Interquartile 75% (IQ3) | 16.1% | 6.0% |
| Interquartile Range (IQR) | 9.7% | 1.2% |
| Standard Deviation (Sample) | 17.8% | 1.1% |
| Standard Deviation (Population) | 17.5% | 1.1% |
Similar Demographics by Unemployment
Demographics Similar to Tohono O'odham by Unemployment
In terms of unemployment, the demographic groups most similar to Tohono O'odham are Hopi (8.9%, a difference of 0.45%), Yuman (9.1%, a difference of 2.1%), Puerto Rican (8.4%, a difference of 5.4%), Navajo (8.4%, a difference of 6.3%), and Pima (8.2%, a difference of 7.9%).
| Demographics | Rating | Rank | Unemployment |
| Immigrants | Dominican Republic | 0.0 /100 | #333 | Tragic 7.4% |
| Apache | 0.0 /100 | #334 | Tragic 7.4% |
| Alaskan Athabascans | 0.0 /100 | #335 | Tragic 7.7% |
| Immigrants | Yemen | 0.0 /100 | #336 | Tragic 7.7% |
| Cheyenne | 0.0 /100 | #337 | Tragic 8.0% |
| Pima | 0.0 /100 | #338 | Tragic 8.2% |
| Navajo | 0.0 /100 | #339 | Tragic 8.4% |
| Puerto Ricans | 0.0 /100 | #340 | Tragic 8.4% |
| Tohono O'odham | 0.0 /100 | #341 | Tragic 8.9% |
| Hopi | 0.0 /100 | #342 | Tragic 8.9% |
| Yuman | 0.0 /100 | #343 | Tragic 9.1% |
| Arapaho | 0.0 /100 | #344 | Tragic 9.8% |
| Inupiat | 0.0 /100 | #345 | Tragic 10.1% |
| Crow | 0.0 /100 | #346 | Tragic 11.1% |
| Yup'ik | 0.0 /100 | #347 | Tragic 13.6% |
Demographics Similar to Nonimmigrants by Unemployment
In terms of unemployment, the demographic groups most similar to Nonimmigrants are Afghan (5.3%, a difference of 0.030%), Nicaraguan (5.3%, a difference of 0.050%), Malaysian (5.3%, a difference of 0.060%), Taiwanese (5.3%, a difference of 0.11%), and Immigrants from Congo (5.3%, a difference of 0.13%).
| Demographics | Rating | Rank | Unemployment |
| Immigrants | Nicaragua | 57.1 /100 | #170 | Average 5.2% |
| Puget Sound Salish | 56.6 /100 | #171 | Average 5.2% |
| Immigrants | Vietnam | 52.5 /100 | #172 | Average 5.2% |
| Immigrants | Poland | 51.8 /100 | #173 | Average 5.3% |
| Immigrants | Congo | 50.0 /100 | #174 | Average 5.3% |
| Taiwanese | 49.6 /100 | #175 | Average 5.3% |
| Nicaraguans | 48.7 /100 | #176 | Average 5.3% |
| Immigrants | Nonimmigrants | 47.9 /100 | #177 | Average 5.3% |
| Afghans | 47.4 /100 | #178 | Average 5.3% |
| Malaysians | 46.8 /100 | #179 | Average 5.3% |
| Immigrants | Greece | 45.0 /100 | #180 | Average 5.3% |
| Albanians | 43.5 /100 | #181 | Average 5.3% |
| Spaniards | 42.2 /100 | #182 | Average 5.3% |
| Brazilians | 40.2 /100 | #183 | Average 5.3% |
| Assyrians/Chaldeans/Syriacs | 39.2 /100 | #184 | Fair 5.3% |