Tohono O'odham vs Kiowa Child Poverty Under the Age of 16
COMPARE
Tohono O'odham
Kiowa
Child Poverty Under the Age of 16
Child Poverty Under the Age of 16 Comparison
Tohono O'odham
Kiowa
31.7%
CHILD POVERTY UNDER THE AGE OF 16
0.0/ 100
METRIC RATING
346th/ 347
METRIC RANK
22.2%
CHILD POVERTY UNDER THE AGE OF 16
0.0/ 100
METRIC RATING
321st/ 347
METRIC RANK
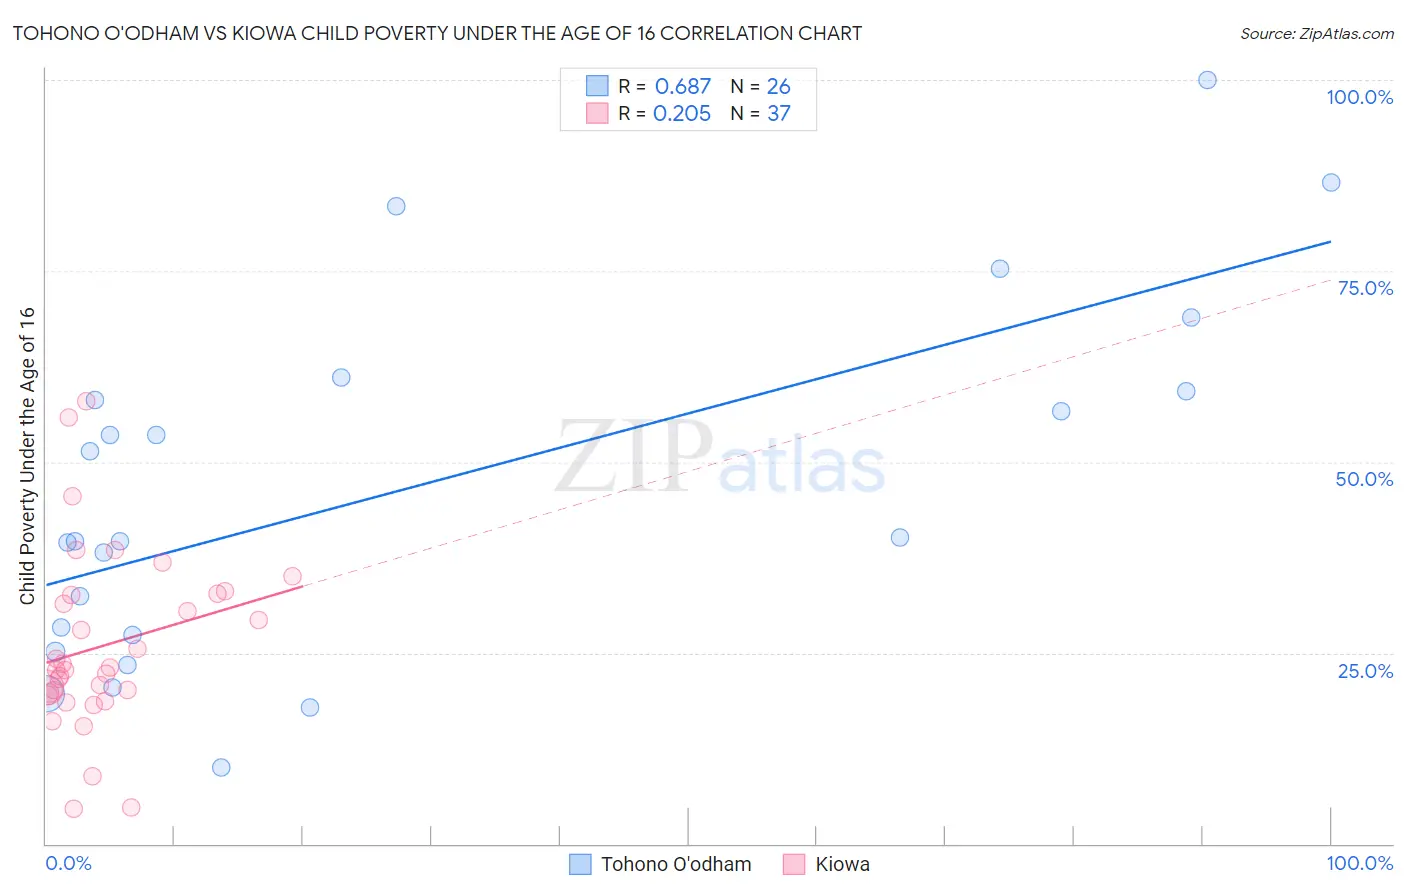
Tohono O'odham vs Kiowa Child Poverty Under the Age of 16 Correlation Chart
The statistical analysis conducted on geographies consisting of 58,687,978 people shows a significant positive correlation between the proportion of Tohono O'odham and poverty level among children under the age of 16 in the United States with a correlation coefficient (R) of 0.687 and weighted average of 31.7%. Similarly, the statistical analysis conducted on geographies consisting of 56,050,498 people shows a weak positive correlation between the proportion of Kiowa and poverty level among children under the age of 16 in the United States with a correlation coefficient (R) of 0.205 and weighted average of 22.2%, a difference of 43.1%.
Child Poverty Under the Age of 16 Correlation Summary
| Measurement | Tohono O'odham | Kiowa |
| Minimum | 9.9% | 4.5% |
| Maximum | 100.0% | 57.9% |
| Range | 90.1% | 53.4% |
| Mean | 46.5% | 25.9% |
| Median | 39.8% | 22.8% |
| Interquartile 25% (IQ1) | 27.3% | 19.6% |
| Interquartile 75% (IQ3) | 59.3% | 32.7% |
| Interquartile Range (IQR) | 32.0% | 13.1% |
| Standard Deviation (Sample) | 23.3% | 11.7% |
| Standard Deviation (Population) | 22.9% | 11.5% |
Similar Demographics by Child Poverty Under the Age of 16
Demographics Similar to Tohono O'odham by Child Poverty Under the Age of 16
In terms of child poverty under the age of 16, the demographic groups most similar to Tohono O'odham are Lumbee (31.0%, a difference of 2.3%), Puerto Rican (32.5%, a difference of 2.6%), Navajo (30.2%, a difference of 4.9%), Immigrants from Yemen (29.1%, a difference of 9.0%), and Pima (29.0%, a difference of 9.2%).
| Demographics | Rating | Rank | Child Poverty Under the Age of 16 |
| Immigrants | Dominican Republic | 0.0 /100 | #333 | Tragic 24.0% |
| Blacks/African Americans | 0.0 /100 | #334 | Tragic 24.4% |
| Houma | 0.0 /100 | #335 | Tragic 24.9% |
| Yup'ik | 0.0 /100 | #336 | Tragic 25.1% |
| Sioux | 0.0 /100 | #337 | Tragic 25.2% |
| Cheyenne | 0.0 /100 | #338 | Tragic 25.4% |
| Crow | 0.0 /100 | #339 | Tragic 26.0% |
| Hopi | 0.0 /100 | #340 | Tragic 27.1% |
| Yuman | 0.0 /100 | #341 | Tragic 28.9% |
| Pima | 0.0 /100 | #342 | Tragic 29.0% |
| Immigrants | Yemen | 0.0 /100 | #343 | Tragic 29.1% |
| Navajo | 0.0 /100 | #344 | Tragic 30.2% |
| Lumbee | 0.0 /100 | #345 | Tragic 31.0% |
| Tohono O'odham | 0.0 /100 | #346 | Tragic 31.7% |
| Puerto Ricans | 0.0 /100 | #347 | Tragic 32.5% |
Demographics Similar to Kiowa by Child Poverty Under the Age of 16
In terms of child poverty under the age of 16, the demographic groups most similar to Kiowa are Cajun (22.1%, a difference of 0.19%), Honduran (22.2%, a difference of 0.19%), Yakama (22.1%, a difference of 0.39%), U.S. Virgin Islander (22.0%, a difference of 0.90%), and Paiute (22.4%, a difference of 1.2%).
| Demographics | Rating | Rank | Child Poverty Under the Age of 16 |
| Immigrants | Somalia | 0.0 /100 | #314 | Tragic 21.6% |
| Immigrants | Guatemala | 0.0 /100 | #315 | Tragic 21.6% |
| Africans | 0.0 /100 | #316 | Tragic 21.7% |
| Immigrants | Dominica | 0.0 /100 | #317 | Tragic 21.9% |
| U.S. Virgin Islanders | 0.0 /100 | #318 | Tragic 22.0% |
| Yakama | 0.0 /100 | #319 | Tragic 22.1% |
| Cajuns | 0.0 /100 | #320 | Tragic 22.1% |
| Kiowa | 0.0 /100 | #321 | Tragic 22.2% |
| Hondurans | 0.0 /100 | #322 | Tragic 22.2% |
| Paiute | 0.0 /100 | #323 | Tragic 22.4% |
| Central American Indians | 0.0 /100 | #324 | Tragic 22.5% |
| Immigrants | Congo | 0.0 /100 | #325 | Tragic 22.5% |
| Immigrants | Honduras | 0.0 /100 | #326 | Tragic 22.7% |
| Menominee | 0.0 /100 | #327 | Tragic 23.0% |
| Colville | 0.0 /100 | #328 | Tragic 23.0% |