Australian vs Kiowa Child Poverty Under the Age of 16
COMPARE
Australian
Kiowa
Child Poverty Under the Age of 16
Child Poverty Under the Age of 16 Comparison
Australians
Kiowa
14.4%
CHILD POVERTY UNDER THE AGE OF 16
97.5/ 100
METRIC RATING
77th/ 347
METRIC RANK
22.2%
CHILD POVERTY UNDER THE AGE OF 16
0.0/ 100
METRIC RATING
321st/ 347
METRIC RANK
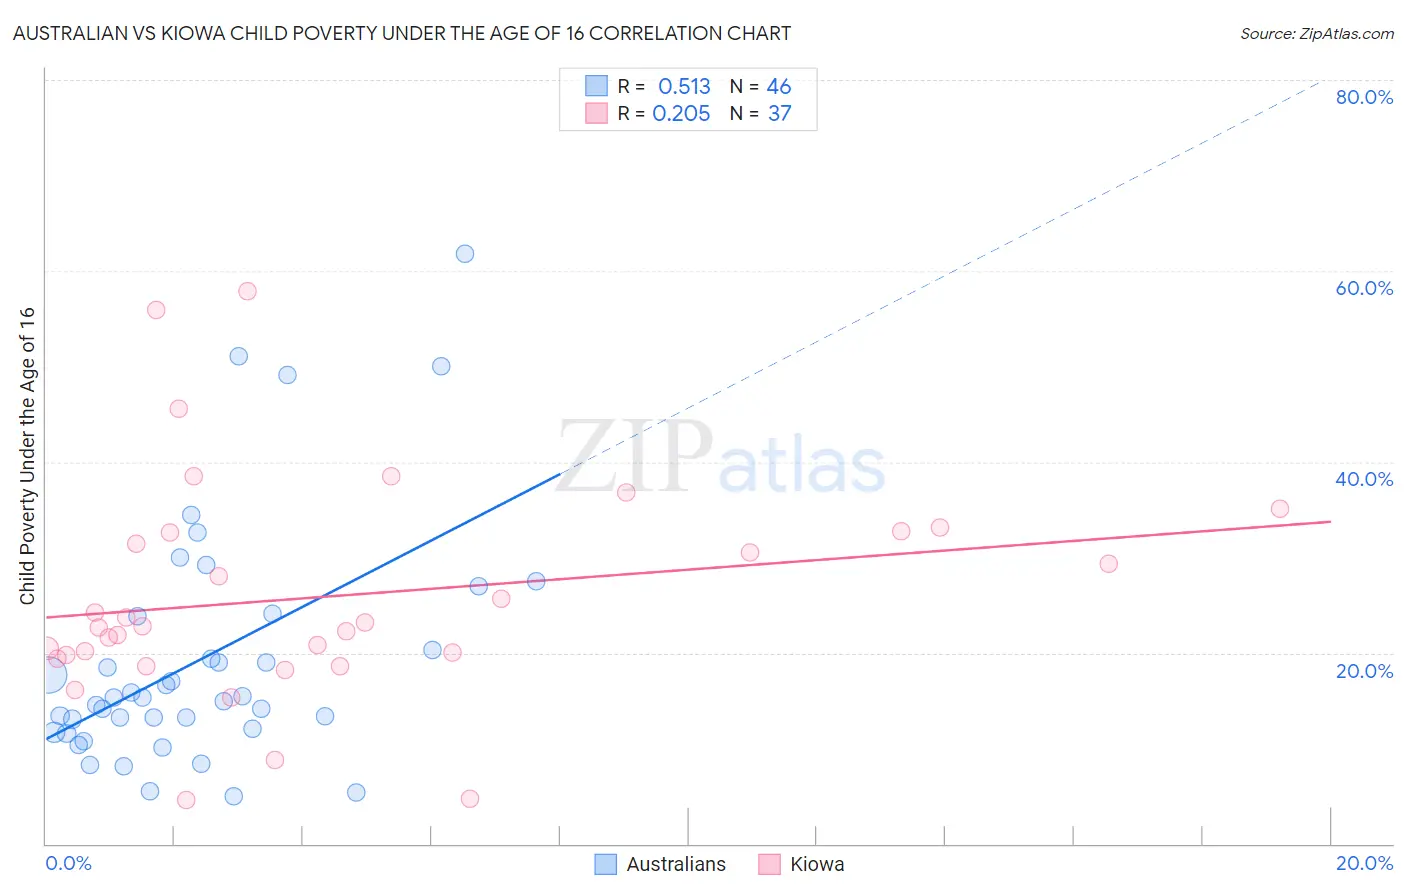
Australian vs Kiowa Child Poverty Under the Age of 16 Correlation Chart
The statistical analysis conducted on geographies consisting of 222,609,541 people shows a substantial positive correlation between the proportion of Australians and poverty level among children under the age of 16 in the United States with a correlation coefficient (R) of 0.513 and weighted average of 14.4%. Similarly, the statistical analysis conducted on geographies consisting of 56,050,498 people shows a weak positive correlation between the proportion of Kiowa and poverty level among children under the age of 16 in the United States with a correlation coefficient (R) of 0.205 and weighted average of 22.2%, a difference of 53.5%.
Child Poverty Under the Age of 16 Correlation Summary
| Measurement | Australian | Kiowa |
| Minimum | 4.9% | 4.5% |
| Maximum | 61.8% | 57.9% |
| Range | 56.9% | 53.4% |
| Mean | 19.4% | 25.9% |
| Median | 15.4% | 22.8% |
| Interquartile 25% (IQ1) | 12.1% | 19.6% |
| Interquartile 75% (IQ3) | 23.8% | 32.7% |
| Interquartile Range (IQR) | 11.7% | 13.1% |
| Standard Deviation (Sample) | 12.6% | 11.7% |
| Standard Deviation (Population) | 12.5% | 11.5% |
Similar Demographics by Child Poverty Under the Age of 16
Demographics Similar to Australians by Child Poverty Under the Age of 16
In terms of child poverty under the age of 16, the demographic groups most similar to Australians are Immigrants from Eastern Europe (14.4%, a difference of 0.030%), Ukrainian (14.4%, a difference of 0.040%), Immigrants from Russia (14.5%, a difference of 0.19%), Swiss (14.5%, a difference of 0.22%), and Macedonian (14.4%, a difference of 0.24%).
| Demographics | Rating | Rank | Child Poverty Under the Age of 16 |
| Immigrants | Netherlands | 97.9 /100 | #70 | Exceptional 14.3% |
| Immigrants | Poland | 97.9 /100 | #71 | Exceptional 14.3% |
| Cambodians | 97.8 /100 | #72 | Exceptional 14.4% |
| Immigrants | Turkey | 97.6 /100 | #73 | Exceptional 14.4% |
| Macedonians | 97.6 /100 | #74 | Exceptional 14.4% |
| Ukrainians | 97.5 /100 | #75 | Exceptional 14.4% |
| Immigrants | Eastern Europe | 97.5 /100 | #76 | Exceptional 14.4% |
| Australians | 97.5 /100 | #77 | Exceptional 14.4% |
| Immigrants | Russia | 97.3 /100 | #78 | Exceptional 14.5% |
| Swiss | 97.3 /100 | #79 | Exceptional 14.5% |
| Immigrants | North Macedonia | 97.2 /100 | #80 | Exceptional 14.5% |
| Finns | 97.2 /100 | #81 | Exceptional 14.5% |
| Immigrants | Canada | 97.2 /100 | #82 | Exceptional 14.5% |
| Egyptians | 97.2 /100 | #83 | Exceptional 14.5% |
| Immigrants | Latvia | 97.1 /100 | #84 | Exceptional 14.5% |
Demographics Similar to Kiowa by Child Poverty Under the Age of 16
In terms of child poverty under the age of 16, the demographic groups most similar to Kiowa are Cajun (22.1%, a difference of 0.19%), Honduran (22.2%, a difference of 0.19%), Yakama (22.1%, a difference of 0.39%), U.S. Virgin Islander (22.0%, a difference of 0.90%), and Paiute (22.4%, a difference of 1.2%).
| Demographics | Rating | Rank | Child Poverty Under the Age of 16 |
| Immigrants | Somalia | 0.0 /100 | #314 | Tragic 21.6% |
| Immigrants | Guatemala | 0.0 /100 | #315 | Tragic 21.6% |
| Africans | 0.0 /100 | #316 | Tragic 21.7% |
| Immigrants | Dominica | 0.0 /100 | #317 | Tragic 21.9% |
| U.S. Virgin Islanders | 0.0 /100 | #318 | Tragic 22.0% |
| Yakama | 0.0 /100 | #319 | Tragic 22.1% |
| Cajuns | 0.0 /100 | #320 | Tragic 22.1% |
| Kiowa | 0.0 /100 | #321 | Tragic 22.2% |
| Hondurans | 0.0 /100 | #322 | Tragic 22.2% |
| Paiute | 0.0 /100 | #323 | Tragic 22.4% |
| Central American Indians | 0.0 /100 | #324 | Tragic 22.5% |
| Immigrants | Congo | 0.0 /100 | #325 | Tragic 22.5% |
| Immigrants | Honduras | 0.0 /100 | #326 | Tragic 22.7% |
| Menominee | 0.0 /100 | #327 | Tragic 23.0% |
| Colville | 0.0 /100 | #328 | Tragic 23.0% |