Bangladeshi vs Kiowa Child Poverty Under the Age of 16
COMPARE
Bangladeshi
Kiowa
Child Poverty Under the Age of 16
Child Poverty Under the Age of 16 Comparison
Bangladeshis
Kiowa
19.9%
CHILD POVERTY UNDER THE AGE OF 16
0.0/ 100
METRIC RATING
278th/ 347
METRIC RANK
22.2%
CHILD POVERTY UNDER THE AGE OF 16
0.0/ 100
METRIC RATING
321st/ 347
METRIC RANK
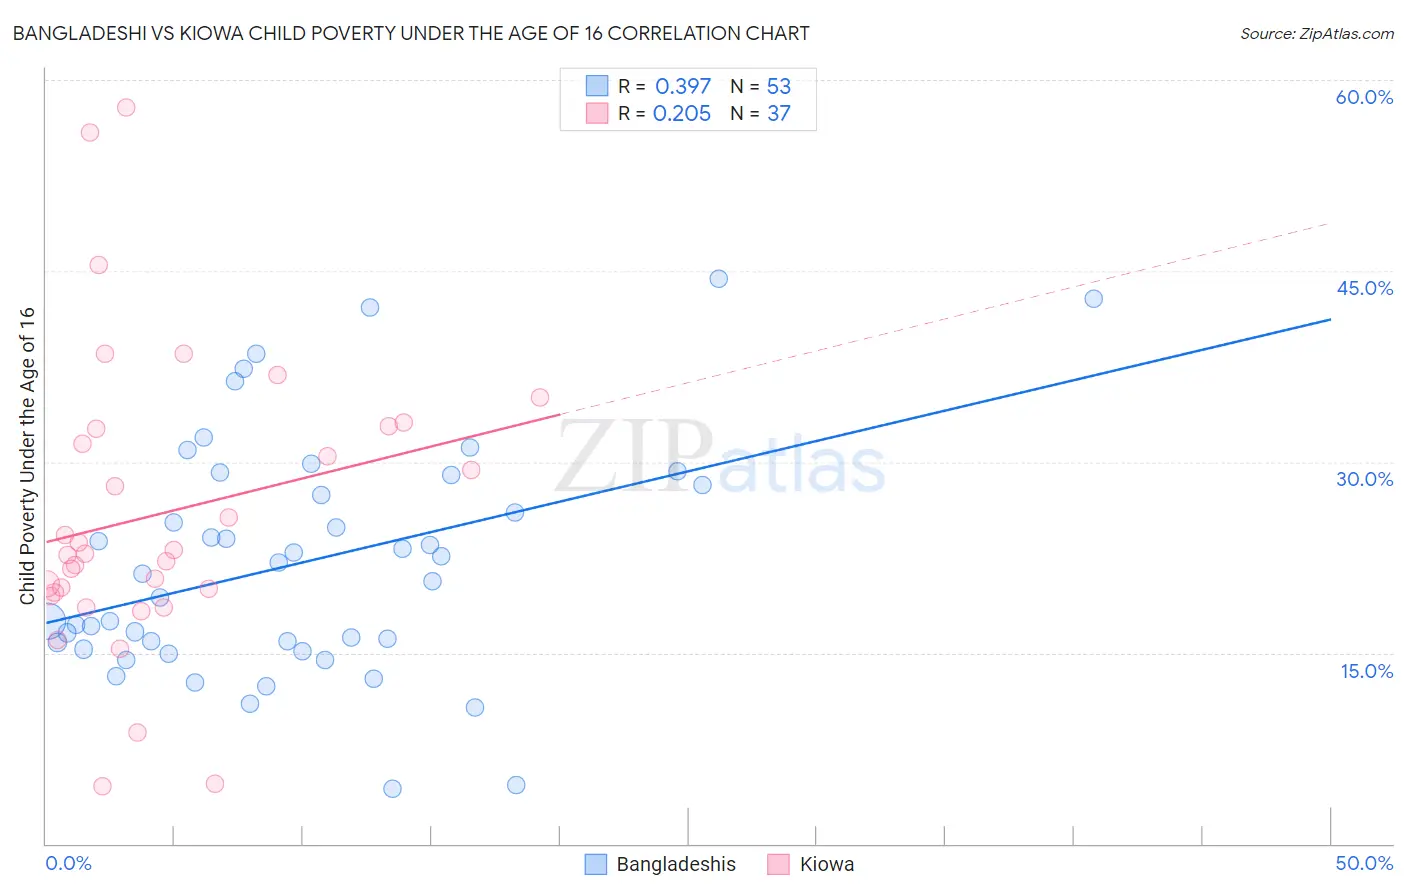
Bangladeshi vs Kiowa Child Poverty Under the Age of 16 Correlation Chart
The statistical analysis conducted on geographies consisting of 140,973,938 people shows a mild positive correlation between the proportion of Bangladeshis and poverty level among children under the age of 16 in the United States with a correlation coefficient (R) of 0.397 and weighted average of 19.9%. Similarly, the statistical analysis conducted on geographies consisting of 56,050,498 people shows a weak positive correlation between the proportion of Kiowa and poverty level among children under the age of 16 in the United States with a correlation coefficient (R) of 0.205 and weighted average of 22.2%, a difference of 11.3%.
Child Poverty Under the Age of 16 Correlation Summary
| Measurement | Bangladeshi | Kiowa |
| Minimum | 4.3% | 4.5% |
| Maximum | 44.4% | 57.9% |
| Range | 40.0% | 53.4% |
| Mean | 22.1% | 25.9% |
| Median | 21.2% | 22.8% |
| Interquartile 25% (IQ1) | 15.5% | 19.6% |
| Interquartile 75% (IQ3) | 28.6% | 32.7% |
| Interquartile Range (IQR) | 13.0% | 13.1% |
| Standard Deviation (Sample) | 9.2% | 11.7% |
| Standard Deviation (Population) | 9.2% | 11.5% |
Similar Demographics by Child Poverty Under the Age of 16
Demographics Similar to Bangladeshis by Child Poverty Under the Age of 16
In terms of child poverty under the age of 16, the demographic groups most similar to Bangladeshis are Subsaharan African (19.9%, a difference of 0.010%), Comanche (19.9%, a difference of 0.010%), Iroquois (19.9%, a difference of 0.10%), Immigrants from Cabo Verde (19.9%, a difference of 0.24%), and Immigrants from Barbados (19.9%, a difference of 0.24%).
| Demographics | Rating | Rank | Child Poverty Under the Age of 16 |
| Immigrants | Liberia | 0.1 /100 | #271 | Tragic 19.7% |
| Immigrants | Bangladesh | 0.1 /100 | #272 | Tragic 19.8% |
| Immigrants | Jamaica | 0.1 /100 | #273 | Tragic 19.8% |
| Immigrants | Cabo Verde | 0.1 /100 | #274 | Tragic 19.9% |
| Immigrants | Barbados | 0.1 /100 | #275 | Tragic 19.9% |
| Belizeans | 0.1 /100 | #276 | Tragic 19.9% |
| Iroquois | 0.1 /100 | #277 | Tragic 19.9% |
| Bangladeshis | 0.0 /100 | #278 | Tragic 19.9% |
| Sub-Saharan Africans | 0.0 /100 | #279 | Tragic 19.9% |
| Comanche | 0.0 /100 | #280 | Tragic 19.9% |
| Central Americans | 0.0 /100 | #281 | Tragic 20.0% |
| Barbadians | 0.0 /100 | #282 | Tragic 20.0% |
| Immigrants | Zaire | 0.0 /100 | #283 | Tragic 20.1% |
| West Indians | 0.0 /100 | #284 | Tragic 20.1% |
| Immigrants | St. Vincent and the Grenadines | 0.0 /100 | #285 | Tragic 20.1% |
Demographics Similar to Kiowa by Child Poverty Under the Age of 16
In terms of child poverty under the age of 16, the demographic groups most similar to Kiowa are Cajun (22.1%, a difference of 0.19%), Honduran (22.2%, a difference of 0.19%), Yakama (22.1%, a difference of 0.39%), U.S. Virgin Islander (22.0%, a difference of 0.90%), and Paiute (22.4%, a difference of 1.2%).
| Demographics | Rating | Rank | Child Poverty Under the Age of 16 |
| Immigrants | Somalia | 0.0 /100 | #314 | Tragic 21.6% |
| Immigrants | Guatemala | 0.0 /100 | #315 | Tragic 21.6% |
| Africans | 0.0 /100 | #316 | Tragic 21.7% |
| Immigrants | Dominica | 0.0 /100 | #317 | Tragic 21.9% |
| U.S. Virgin Islanders | 0.0 /100 | #318 | Tragic 22.0% |
| Yakama | 0.0 /100 | #319 | Tragic 22.1% |
| Cajuns | 0.0 /100 | #320 | Tragic 22.1% |
| Kiowa | 0.0 /100 | #321 | Tragic 22.2% |
| Hondurans | 0.0 /100 | #322 | Tragic 22.2% |
| Paiute | 0.0 /100 | #323 | Tragic 22.4% |
| Central American Indians | 0.0 /100 | #324 | Tragic 22.5% |
| Immigrants | Congo | 0.0 /100 | #325 | Tragic 22.5% |
| Immigrants | Honduras | 0.0 /100 | #326 | Tragic 22.7% |
| Menominee | 0.0 /100 | #327 | Tragic 23.0% |
| Colville | 0.0 /100 | #328 | Tragic 23.0% |