Immigrants from Norway vs Kiowa Child Poverty Under the Age of 16
COMPARE
Immigrants from Norway
Kiowa
Child Poverty Under the Age of 16
Child Poverty Under the Age of 16 Comparison
Immigrants from Norway
Kiowa
15.0%
CHILD POVERTY UNDER THE AGE OF 16
92.8/ 100
METRIC RATING
117th/ 347
METRIC RANK
22.2%
CHILD POVERTY UNDER THE AGE OF 16
0.0/ 100
METRIC RATING
321st/ 347
METRIC RANK
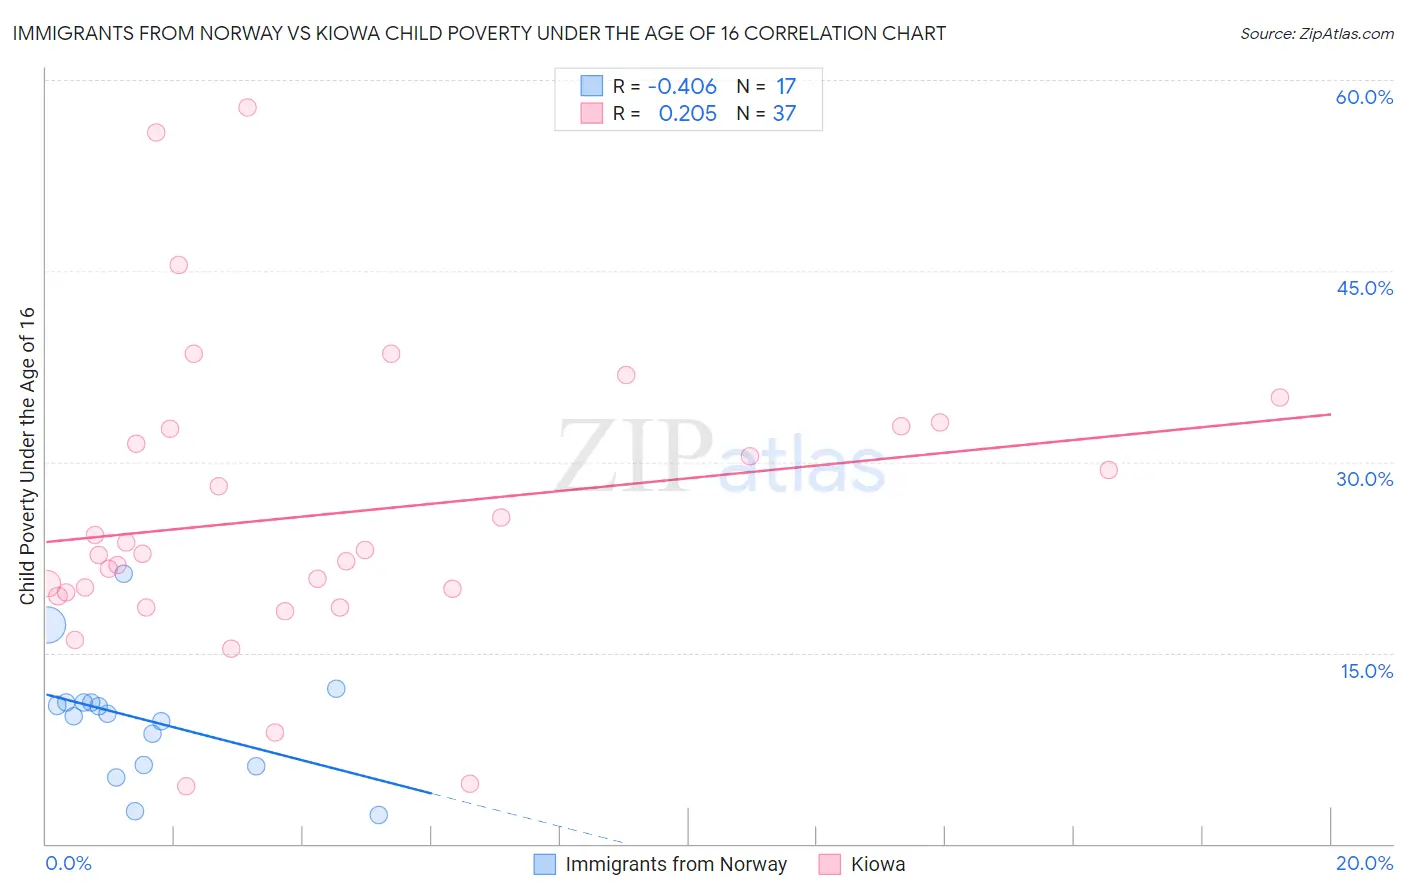
Immigrants from Norway vs Kiowa Child Poverty Under the Age of 16 Correlation Chart
The statistical analysis conducted on geographies consisting of 116,192,313 people shows a moderate negative correlation between the proportion of Immigrants from Norway and poverty level among children under the age of 16 in the United States with a correlation coefficient (R) of -0.406 and weighted average of 15.0%. Similarly, the statistical analysis conducted on geographies consisting of 56,050,498 people shows a weak positive correlation between the proportion of Kiowa and poverty level among children under the age of 16 in the United States with a correlation coefficient (R) of 0.205 and weighted average of 22.2%, a difference of 48.0%.
Child Poverty Under the Age of 16 Correlation Summary
| Measurement | Immigrants from Norway | Kiowa |
| Minimum | 2.2% | 4.5% |
| Maximum | 21.2% | 57.9% |
| Range | 19.0% | 53.4% |
| Mean | 9.8% | 25.9% |
| Median | 10.2% | 22.8% |
| Interquartile 25% (IQ1) | 6.1% | 19.6% |
| Interquartile 75% (IQ3) | 11.1% | 32.7% |
| Interquartile Range (IQR) | 5.0% | 13.1% |
| Standard Deviation (Sample) | 4.7% | 11.7% |
| Standard Deviation (Population) | 4.6% | 11.5% |
Similar Demographics by Child Poverty Under the Age of 16
Demographics Similar to Immigrants from Norway by Child Poverty Under the Age of 16
In terms of child poverty under the age of 16, the demographic groups most similar to Immigrants from Norway are Immigrants from Malaysia (15.0%, a difference of 0.060%), Carpatho Rusyn (14.9%, a difference of 0.15%), Immigrants from Ukraine (14.9%, a difference of 0.17%), Scottish (15.0%, a difference of 0.21%), and Sri Lankan (14.9%, a difference of 0.23%).
| Demographics | Rating | Rank | Child Poverty Under the Age of 16 |
| English | 93.5 /100 | #110 | Exceptional 14.9% |
| Immigrants | Denmark | 93.5 /100 | #111 | Exceptional 14.9% |
| Irish | 93.4 /100 | #112 | Exceptional 14.9% |
| Belgians | 93.3 /100 | #113 | Exceptional 14.9% |
| Sri Lankans | 93.2 /100 | #114 | Exceptional 14.9% |
| Immigrants | Ukraine | 93.1 /100 | #115 | Exceptional 14.9% |
| Carpatho Rusyns | 93.1 /100 | #116 | Exceptional 14.9% |
| Immigrants | Norway | 92.8 /100 | #117 | Exceptional 15.0% |
| Immigrants | Malaysia | 92.6 /100 | #118 | Exceptional 15.0% |
| Scottish | 92.3 /100 | #119 | Exceptional 15.0% |
| South Africans | 92.1 /100 | #120 | Exceptional 15.0% |
| Immigrants | Zimbabwe | 92.1 /100 | #121 | Exceptional 15.0% |
| Pakistanis | 91.7 /100 | #122 | Exceptional 15.0% |
| Immigrants | Brazil | 91.1 /100 | #123 | Exceptional 15.1% |
| Czechoslovakians | 91.0 /100 | #124 | Exceptional 15.1% |
Demographics Similar to Kiowa by Child Poverty Under the Age of 16
In terms of child poverty under the age of 16, the demographic groups most similar to Kiowa are Cajun (22.1%, a difference of 0.19%), Honduran (22.2%, a difference of 0.19%), Yakama (22.1%, a difference of 0.39%), U.S. Virgin Islander (22.0%, a difference of 0.90%), and Paiute (22.4%, a difference of 1.2%).
| Demographics | Rating | Rank | Child Poverty Under the Age of 16 |
| Immigrants | Somalia | 0.0 /100 | #314 | Tragic 21.6% |
| Immigrants | Guatemala | 0.0 /100 | #315 | Tragic 21.6% |
| Africans | 0.0 /100 | #316 | Tragic 21.7% |
| Immigrants | Dominica | 0.0 /100 | #317 | Tragic 21.9% |
| U.S. Virgin Islanders | 0.0 /100 | #318 | Tragic 22.0% |
| Yakama | 0.0 /100 | #319 | Tragic 22.1% |
| Cajuns | 0.0 /100 | #320 | Tragic 22.1% |
| Kiowa | 0.0 /100 | #321 | Tragic 22.2% |
| Hondurans | 0.0 /100 | #322 | Tragic 22.2% |
| Paiute | 0.0 /100 | #323 | Tragic 22.4% |
| Central American Indians | 0.0 /100 | #324 | Tragic 22.5% |
| Immigrants | Congo | 0.0 /100 | #325 | Tragic 22.5% |
| Immigrants | Honduras | 0.0 /100 | #326 | Tragic 22.7% |
| Menominee | 0.0 /100 | #327 | Tragic 23.0% |
| Colville | 0.0 /100 | #328 | Tragic 23.0% |