Tohono O'odham vs Dominican Per Capita Income
COMPARE
Tohono O'odham
Dominican
Per Capita Income
Per Capita Income Comparison
Tohono O'odham
Dominicans
$30,256
PER CAPITA INCOME
0.0/ 100
METRIC RATING
345th/ 347
METRIC RANK
$37,697
PER CAPITA INCOME
0.1/ 100
METRIC RATING
287th/ 347
METRIC RANK
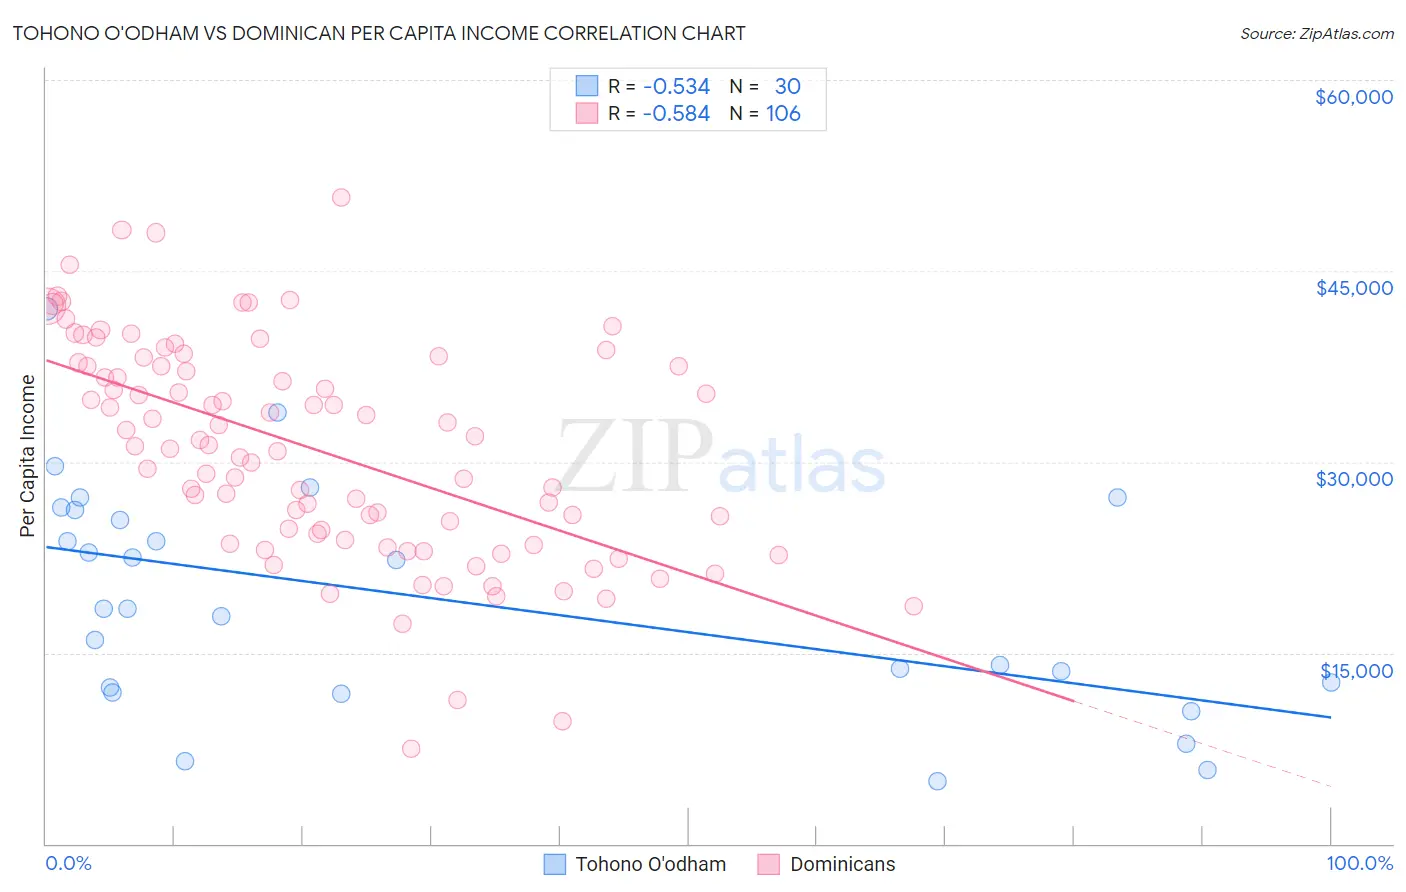
Tohono O'odham vs Dominican Per Capita Income Correlation Chart
The statistical analysis conducted on geographies consisting of 58,730,368 people shows a substantial negative correlation between the proportion of Tohono O'odham and per capita income in the United States with a correlation coefficient (R) of -0.534 and weighted average of $30,256. Similarly, the statistical analysis conducted on geographies consisting of 355,170,092 people shows a substantial negative correlation between the proportion of Dominicans and per capita income in the United States with a correlation coefficient (R) of -0.584 and weighted average of $37,697, a difference of 24.6%.
Per Capita Income Correlation Summary
| Measurement | Tohono O'odham | Dominican |
| Minimum | $4,874 | $7,474 |
| Maximum | $41,987 | $50,766 |
| Range | $37,113 | $43,292 |
| Mean | $19,246 | $30,940 |
| Median | $18,448 | $31,292 |
| Interquartile 25% (IQ1) | $12,324 | $23,892 |
| Interquartile 75% (IQ3) | $26,227 | $37,544 |
| Interquartile Range (IQR) | $13,903 | $13,652 |
| Standard Deviation (Sample) | $8,934 | $8,599 |
| Standard Deviation (Population) | $8,784 | $8,559 |
Similar Demographics by Per Capita Income
Demographics Similar to Tohono O'odham by Per Capita Income
In terms of per capita income, the demographic groups most similar to Tohono O'odham are Yup'ik ($30,518, a difference of 0.87%), Pima ($30,644, a difference of 1.3%), Lumbee ($29,845, a difference of 1.4%), Hopi ($31,177, a difference of 3.0%), and Puerto Rican ($31,268, a difference of 3.4%).
| Demographics | Rating | Rank | Per Capita Income |
| Immigrants | Yemen | 0.0 /100 | #333 | Tragic $33,696 |
| Natives/Alaskans | 0.0 /100 | #334 | Tragic $33,279 |
| Yuman | 0.0 /100 | #335 | Tragic $33,236 |
| Yakama | 0.0 /100 | #336 | Tragic $33,009 |
| Houma | 0.0 /100 | #337 | Tragic $32,996 |
| Arapaho | 0.0 /100 | #338 | Tragic $32,345 |
| Pueblo | 0.0 /100 | #339 | Tragic $32,012 |
| Crow | 0.0 /100 | #340 | Tragic $31,729 |
| Puerto Ricans | 0.0 /100 | #341 | Tragic $31,268 |
| Hopi | 0.0 /100 | #342 | Tragic $31,177 |
| Pima | 0.0 /100 | #343 | Tragic $30,644 |
| Yup'ik | 0.0 /100 | #344 | Tragic $30,518 |
| Tohono O'odham | 0.0 /100 | #345 | Tragic $30,256 |
| Lumbee | 0.0 /100 | #346 | Tragic $29,845 |
| Navajo | 0.0 /100 | #347 | Tragic $29,031 |
Demographics Similar to Dominicans by Per Capita Income
In terms of per capita income, the demographic groups most similar to Dominicans are Blackfeet ($37,695, a difference of 0.0%), Central American Indian ($37,699, a difference of 0.010%), Guatemalan ($37,766, a difference of 0.19%), African ($37,785, a difference of 0.24%), and U.S. Virgin Islander ($37,589, a difference of 0.29%).
| Demographics | Rating | Rank | Per Capita Income |
| Potawatomi | 0.2 /100 | #280 | Tragic $38,046 |
| Immigrants | Dominica | 0.2 /100 | #281 | Tragic $37,952 |
| Immigrants | Laos | 0.1 /100 | #282 | Tragic $37,857 |
| Pennsylvania Germans | 0.1 /100 | #283 | Tragic $37,842 |
| Africans | 0.1 /100 | #284 | Tragic $37,785 |
| Guatemalans | 0.1 /100 | #285 | Tragic $37,766 |
| Central American Indians | 0.1 /100 | #286 | Tragic $37,699 |
| Dominicans | 0.1 /100 | #287 | Tragic $37,697 |
| Blackfeet | 0.1 /100 | #288 | Tragic $37,695 |
| U.S. Virgin Islanders | 0.1 /100 | #289 | Tragic $37,589 |
| Immigrants | Guatemala | 0.1 /100 | #290 | Tragic $37,550 |
| Cajuns | 0.1 /100 | #291 | Tragic $37,527 |
| Immigrants | Micronesia | 0.1 /100 | #292 | Tragic $37,464 |
| Mexican American Indians | 0.1 /100 | #293 | Tragic $37,407 |
| Cubans | 0.1 /100 | #294 | Tragic $37,383 |