Hopi vs White/Caucasian Child Poverty Under the Age of 16
COMPARE
Hopi
White/Caucasian
Child Poverty Under the Age of 16
Child Poverty Under the Age of 16 Comparison
Hopi
Whites/Caucasians
27.1%
CHILD POVERTY UNDER THE AGE OF 16
0.0/ 100
METRIC RATING
340th/ 347
METRIC RANK
16.2%
CHILD POVERTY UNDER THE AGE OF 16
50.0/ 100
METRIC RATING
174th/ 347
METRIC RANK
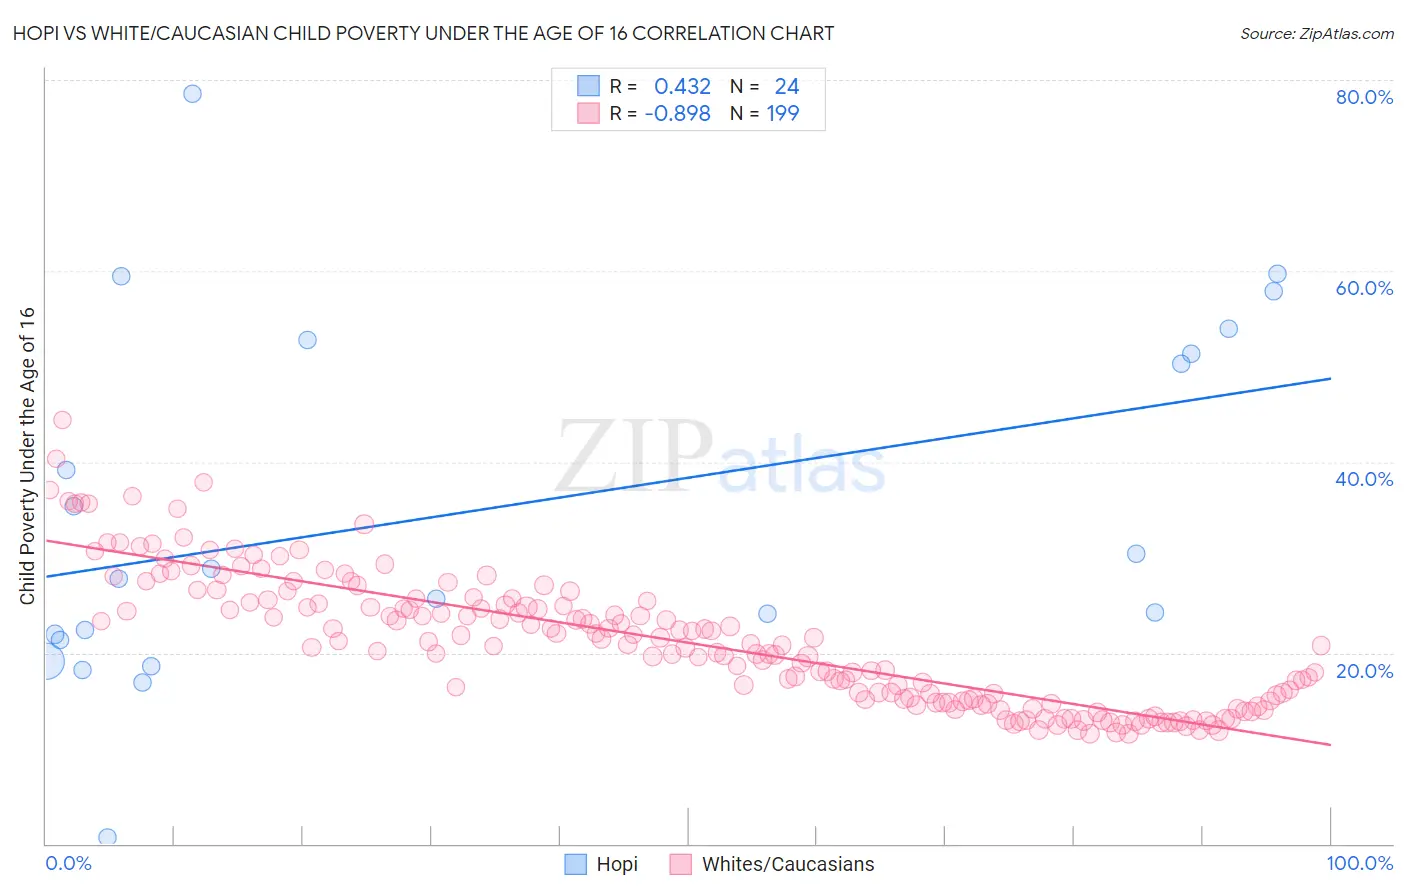
Hopi vs White/Caucasian Child Poverty Under the Age of 16 Correlation Chart
The statistical analysis conducted on geographies consisting of 74,667,106 people shows a moderate positive correlation between the proportion of Hopi and poverty level among children under the age of 16 in the United States with a correlation coefficient (R) of 0.432 and weighted average of 27.1%. Similarly, the statistical analysis conducted on geographies consisting of 568,969,283 people shows a very strong negative correlation between the proportion of Whites/Caucasians and poverty level among children under the age of 16 in the United States with a correlation coefficient (R) of -0.898 and weighted average of 16.2%, a difference of 67.3%.
Child Poverty Under the Age of 16 Correlation Summary
| Measurement | Hopi | White/Caucasian |
| Minimum | 0.70% | 11.5% |
| Maximum | 78.6% | 44.4% |
| Range | 77.9% | 32.8% |
| Mean | 34.9% | 21.1% |
| Median | 28.3% | 20.8% |
| Interquartile 25% (IQ1) | 21.6% | 15.0% |
| Interquartile 75% (IQ3) | 52.0% | 25.3% |
| Interquartile Range (IQR) | 30.4% | 10.4% |
| Standard Deviation (Sample) | 18.7% | 6.9% |
| Standard Deviation (Population) | 18.4% | 6.8% |
Similar Demographics by Child Poverty Under the Age of 16
Demographics Similar to Hopi by Child Poverty Under the Age of 16
In terms of child poverty under the age of 16, the demographic groups most similar to Hopi are Crow (26.0%, a difference of 4.4%), Yuman (28.9%, a difference of 6.8%), Cheyenne (25.4%, a difference of 6.8%), Pima (29.0%, a difference of 7.1%), and Immigrants from Yemen (29.1%, a difference of 7.3%).
| Demographics | Rating | Rank | Child Poverty Under the Age of 16 |
| Immigrants | Dominican Republic | 0.0 /100 | #333 | Tragic 24.0% |
| Blacks/African Americans | 0.0 /100 | #334 | Tragic 24.4% |
| Houma | 0.0 /100 | #335 | Tragic 24.9% |
| Yup'ik | 0.0 /100 | #336 | Tragic 25.1% |
| Sioux | 0.0 /100 | #337 | Tragic 25.2% |
| Cheyenne | 0.0 /100 | #338 | Tragic 25.4% |
| Crow | 0.0 /100 | #339 | Tragic 26.0% |
| Hopi | 0.0 /100 | #340 | Tragic 27.1% |
| Yuman | 0.0 /100 | #341 | Tragic 28.9% |
| Pima | 0.0 /100 | #342 | Tragic 29.0% |
| Immigrants | Yemen | 0.0 /100 | #343 | Tragic 29.1% |
| Navajo | 0.0 /100 | #344 | Tragic 30.2% |
| Lumbee | 0.0 /100 | #345 | Tragic 31.0% |
| Tohono O'odham | 0.0 /100 | #346 | Tragic 31.7% |
| Puerto Ricans | 0.0 /100 | #347 | Tragic 32.5% |
Demographics Similar to Whites/Caucasians by Child Poverty Under the Age of 16
In terms of child poverty under the age of 16, the demographic groups most similar to Whites/Caucasians are Immigrants from Saudi Arabia (16.2%, a difference of 0.25%), Afghan (16.2%, a difference of 0.27%), Hungarian (16.2%, a difference of 0.30%), Scotch-Irish (16.3%, a difference of 0.34%), and Lebanese (16.3%, a difference of 0.50%).
| Demographics | Rating | Rank | Child Poverty Under the Age of 16 |
| Costa Ricans | 61.1 /100 | #167 | Good 16.0% |
| South Americans | 57.9 /100 | #168 | Average 16.0% |
| Uruguayans | 54.7 /100 | #169 | Average 16.1% |
| Immigrants | Colombia | 54.4 /100 | #170 | Average 16.1% |
| Hungarians | 52.5 /100 | #171 | Average 16.2% |
| Afghans | 52.3 /100 | #172 | Average 16.2% |
| Immigrants | Saudi Arabia | 52.1 /100 | #173 | Average 16.2% |
| Whites/Caucasians | 50.0 /100 | #174 | Average 16.2% |
| Scotch-Irish | 47.1 /100 | #175 | Average 16.3% |
| Lebanese | 45.9 /100 | #176 | Average 16.3% |
| Ethiopians | 43.4 /100 | #177 | Average 16.3% |
| Immigrants | Ethiopia | 42.3 /100 | #178 | Average 16.4% |
| Immigrants | Syria | 42.3 /100 | #179 | Average 16.4% |
| South American Indians | 41.8 /100 | #180 | Average 16.4% |
| Immigrants | South America | 40.8 /100 | #181 | Average 16.4% |