Immigrants from Burma/Myanmar vs White/Caucasian Child Poverty Under the Age of 16
COMPARE
Immigrants from Burma/Myanmar
White/Caucasian
Child Poverty Under the Age of 16
Child Poverty Under the Age of 16 Comparison
Immigrants from Burma/Myanmar
Whites/Caucasians
19.4%
CHILD POVERTY UNDER THE AGE OF 16
0.1/ 100
METRIC RATING
261st/ 347
METRIC RANK
16.2%
CHILD POVERTY UNDER THE AGE OF 16
50.0/ 100
METRIC RATING
174th/ 347
METRIC RANK
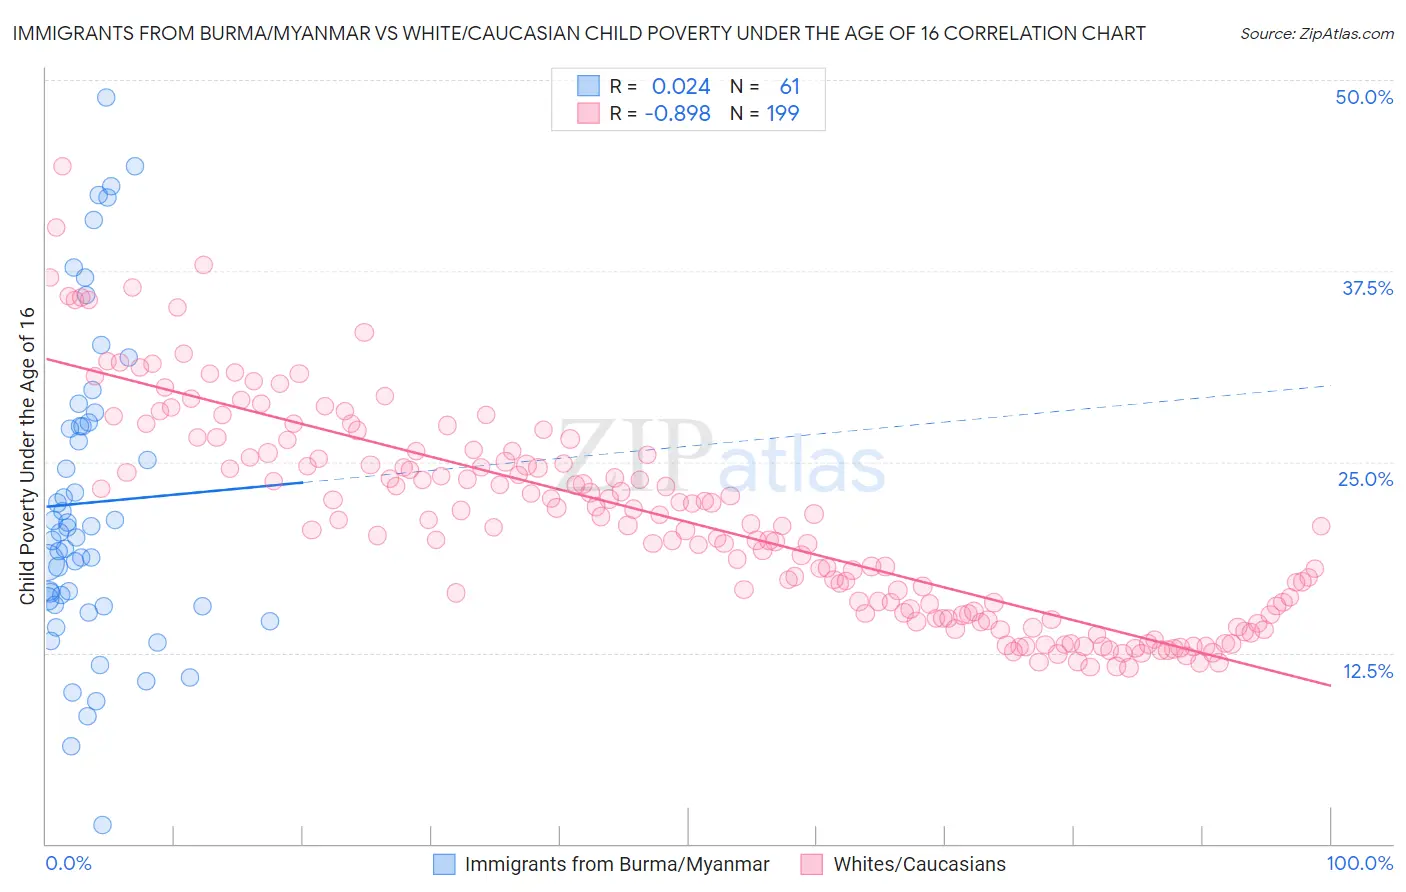
Immigrants from Burma/Myanmar vs White/Caucasian Child Poverty Under the Age of 16 Correlation Chart
The statistical analysis conducted on geographies consisting of 171,826,870 people shows no correlation between the proportion of Immigrants from Burma/Myanmar and poverty level among children under the age of 16 in the United States with a correlation coefficient (R) of 0.024 and weighted average of 19.4%. Similarly, the statistical analysis conducted on geographies consisting of 568,969,283 people shows a very strong negative correlation between the proportion of Whites/Caucasians and poverty level among children under the age of 16 in the United States with a correlation coefficient (R) of -0.898 and weighted average of 16.2%, a difference of 19.5%.
Child Poverty Under the Age of 16 Correlation Summary
| Measurement | Immigrants from Burma/Myanmar | White/Caucasian |
| Minimum | 1.2% | 11.5% |
| Maximum | 48.9% | 44.4% |
| Range | 47.6% | 32.8% |
| Mean | 22.3% | 21.1% |
| Median | 20.4% | 20.8% |
| Interquartile 25% (IQ1) | 15.6% | 15.0% |
| Interquartile 75% (IQ3) | 27.5% | 25.3% |
| Interquartile Range (IQR) | 11.9% | 10.4% |
| Standard Deviation (Sample) | 10.2% | 6.9% |
| Standard Deviation (Population) | 10.1% | 6.8% |
Similar Demographics by Child Poverty Under the Age of 16
Demographics Similar to Immigrants from Burma/Myanmar by Child Poverty Under the Age of 16
In terms of child poverty under the age of 16, the demographic groups most similar to Immigrants from Burma/Myanmar are Immigrants from Guyana (19.4%, a difference of 0.040%), Guyanese (19.3%, a difference of 0.080%), Mexican American Indian (19.3%, a difference of 0.18%), Vietnamese (19.4%, a difference of 0.36%), and Immigrants from Ecuador (19.4%, a difference of 0.42%).
| Demographics | Rating | Rank | Child Poverty Under the Age of 16 |
| Immigrants | Western Africa | 0.2 /100 | #254 | Tragic 19.2% |
| Trinidadians and Tobagonians | 0.2 /100 | #255 | Tragic 19.2% |
| Inupiat | 0.2 /100 | #256 | Tragic 19.2% |
| Ottawa | 0.2 /100 | #257 | Tragic 19.2% |
| Spanish Americans | 0.2 /100 | #258 | Tragic 19.2% |
| Mexican American Indians | 0.2 /100 | #259 | Tragic 19.3% |
| Guyanese | 0.2 /100 | #260 | Tragic 19.3% |
| Immigrants | Burma/Myanmar | 0.1 /100 | #261 | Tragic 19.4% |
| Immigrants | Guyana | 0.1 /100 | #262 | Tragic 19.4% |
| Vietnamese | 0.1 /100 | #263 | Tragic 19.4% |
| Immigrants | Ecuador | 0.1 /100 | #264 | Tragic 19.4% |
| Chickasaw | 0.1 /100 | #265 | Tragic 19.5% |
| Liberians | 0.1 /100 | #266 | Tragic 19.5% |
| Cherokee | 0.1 /100 | #267 | Tragic 19.5% |
| Jamaicans | 0.1 /100 | #268 | Tragic 19.7% |
Demographics Similar to Whites/Caucasians by Child Poverty Under the Age of 16
In terms of child poverty under the age of 16, the demographic groups most similar to Whites/Caucasians are Immigrants from Saudi Arabia (16.2%, a difference of 0.25%), Afghan (16.2%, a difference of 0.27%), Hungarian (16.2%, a difference of 0.30%), Scotch-Irish (16.3%, a difference of 0.34%), and Lebanese (16.3%, a difference of 0.50%).
| Demographics | Rating | Rank | Child Poverty Under the Age of 16 |
| Costa Ricans | 61.1 /100 | #167 | Good 16.0% |
| South Americans | 57.9 /100 | #168 | Average 16.0% |
| Uruguayans | 54.7 /100 | #169 | Average 16.1% |
| Immigrants | Colombia | 54.4 /100 | #170 | Average 16.1% |
| Hungarians | 52.5 /100 | #171 | Average 16.2% |
| Afghans | 52.3 /100 | #172 | Average 16.2% |
| Immigrants | Saudi Arabia | 52.1 /100 | #173 | Average 16.2% |
| Whites/Caucasians | 50.0 /100 | #174 | Average 16.2% |
| Scotch-Irish | 47.1 /100 | #175 | Average 16.3% |
| Lebanese | 45.9 /100 | #176 | Average 16.3% |
| Ethiopians | 43.4 /100 | #177 | Average 16.3% |
| Immigrants | Ethiopia | 42.3 /100 | #178 | Average 16.4% |
| Immigrants | Syria | 42.3 /100 | #179 | Average 16.4% |
| South American Indians | 41.8 /100 | #180 | Average 16.4% |
| Immigrants | South America | 40.8 /100 | #181 | Average 16.4% |